How to Identify Stock Trends
Identifying trend is one of the most important skills in chart reading. Before using indicators, traders should first understand whether price is moving up, moving down, or simply drifting sideways.
A clear trend gives context to everything else on the chart. It helps you judge whether momentum is healthy, whether pullbacks are normal, and whether signals should be treated as continuation or reversal risk.
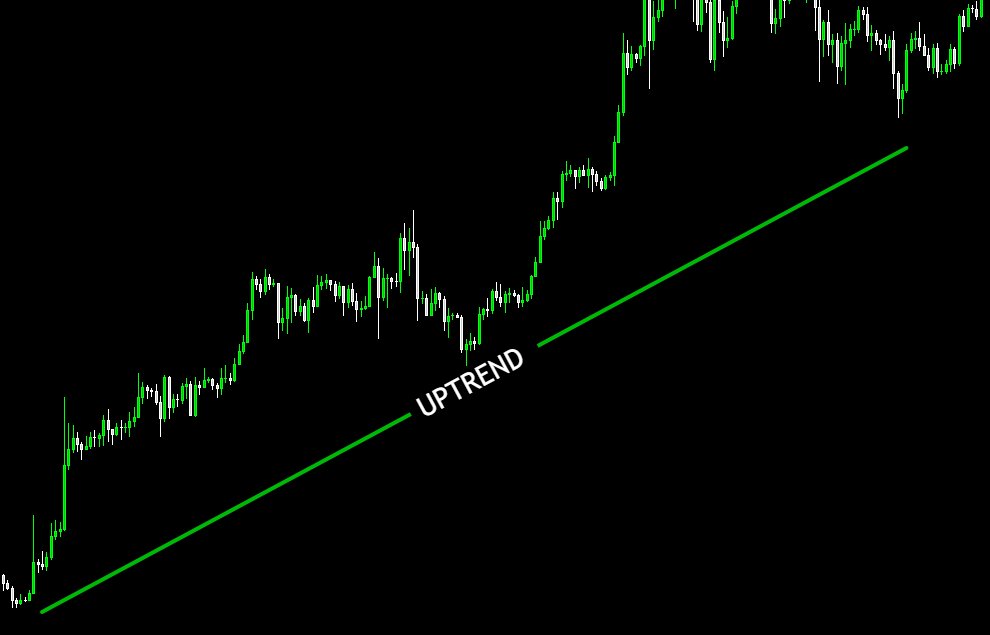
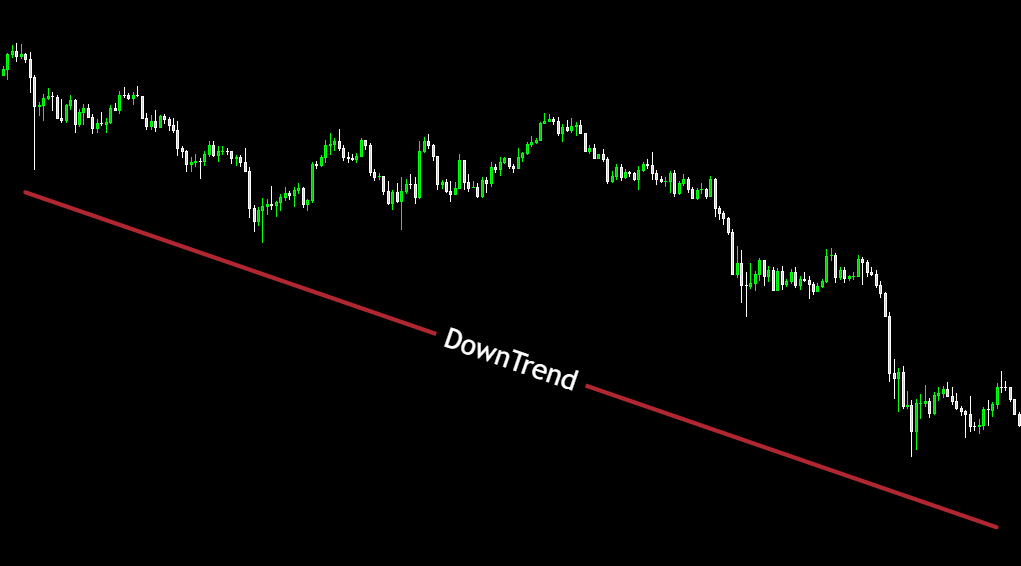
1. Start with price structure
The simplest way to identify trend is by looking at structure. Ask whether price is making:
This should always come before indicators. Trend begins with price.
2. Use moving averages to simplify the chart
Moving averages are one of the easiest ways for beginners to confirm trend direction. The 50-day and 200-day moving averages are especially useful.
3. Check whether momentum agrees
A healthy trend usually has momentum behind it. This is where indicators like RSI and MACD can help.
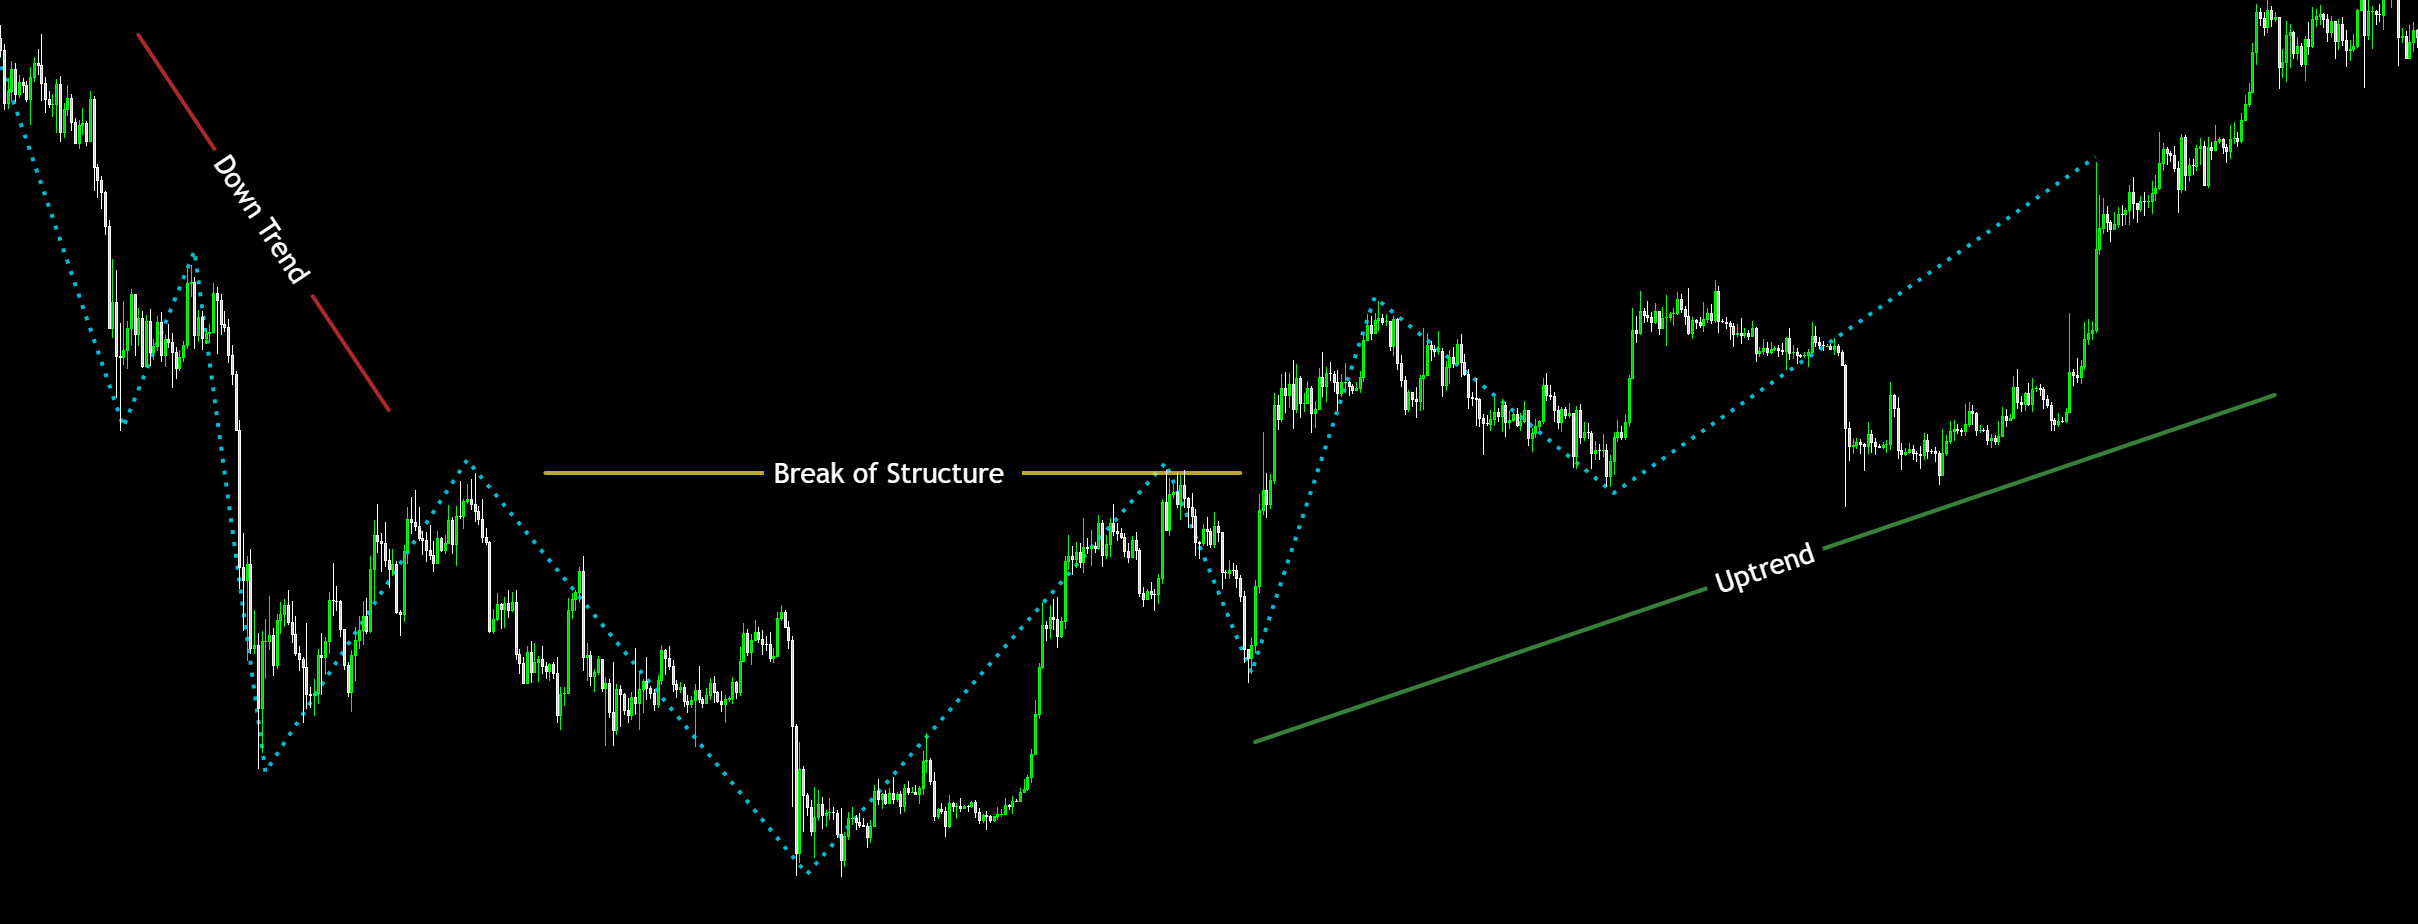
4. Recognise pullbacks versus reversals
One of the hardest parts of trend reading is knowing whether price is simply pulling back or actually reversing.
In a healthy uptrend, price often pulls back without breaking the larger structure. In a real reversal, price starts breaking key lows, losing moving-average support, and showing weaker momentum.
5. Use market context
A stock trend is easier to trust when the wider market supports it. That is why market benchmarks and volatility context matter.
A stock trying to trend higher in a weak market often faces more resistance than one moving with a strong broader market.
Common beginner mistake
A common mistake is looking for reversal signals too early and fighting an obvious trend. Many beginners try to call the top or bottom before the chart structure has actually changed.
A better approach is to respect the existing trend until price, structure, and momentum clearly suggest otherwise.
Simple beginner checklist
MyStockHarbor helps you quickly assess trend, stretch, momentum, divergence, and market context so you can understand whether a stock is moving strongly or simply drifting.
If you want to explore real examples, visit the Find Your Next Stock page. It groups live stocks into categories like oversold setups, divergence signals, buy-the-dip candidates and breakout stocks so you can quickly spot charts worth reviewing.