Divergencies
MACD Divergence
When price pushes but MACD momentum doesn’t — a useful ‘weakening’ clue.
How to use this lesson
Read it once, then open a chart and try to spot the same idea in 60 seconds. Repetition beats complexity.
What it is
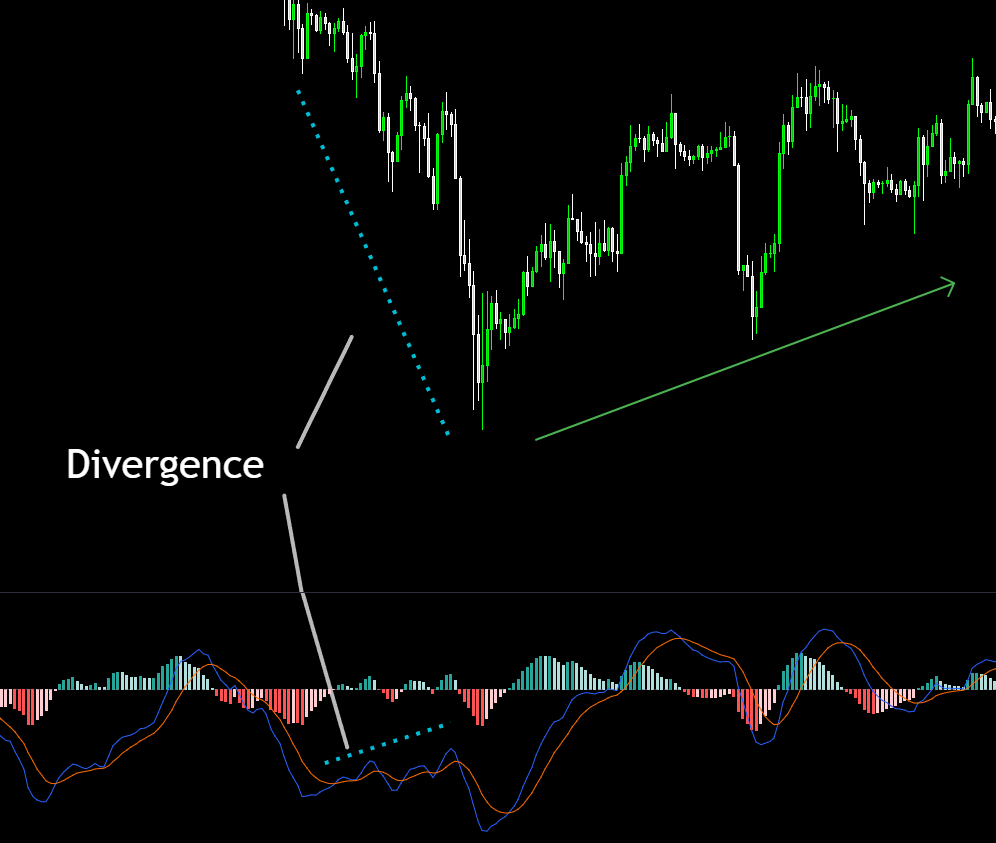
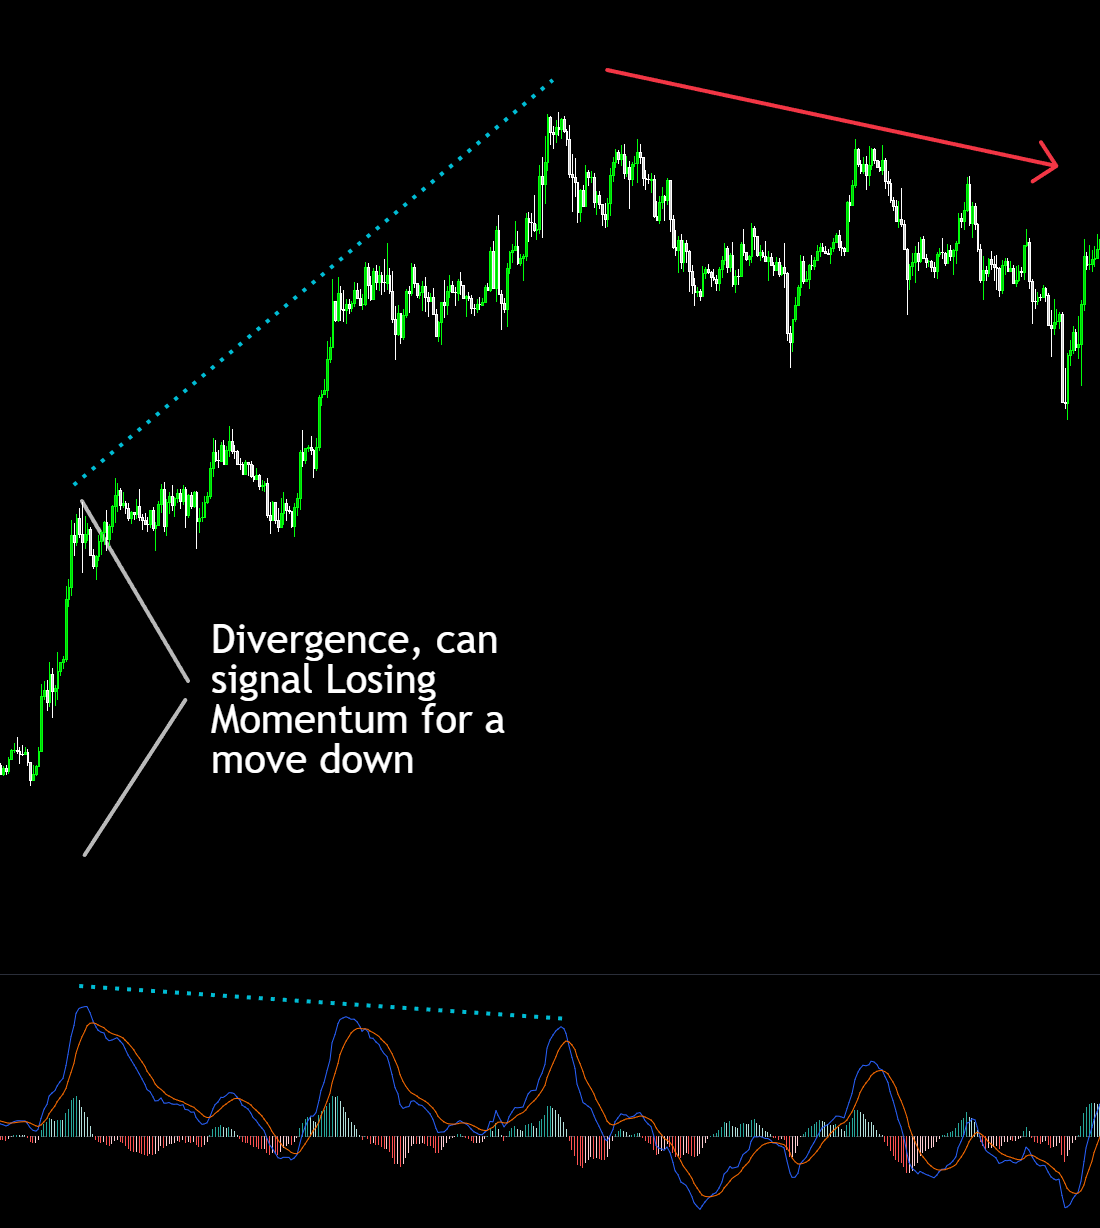
Divergence is when price makes a new high/low, but MACD does not.
It highlights momentum disagreement with price.
Like RSI divergence, it’s a warning light — not a guarantee.
How to identify it
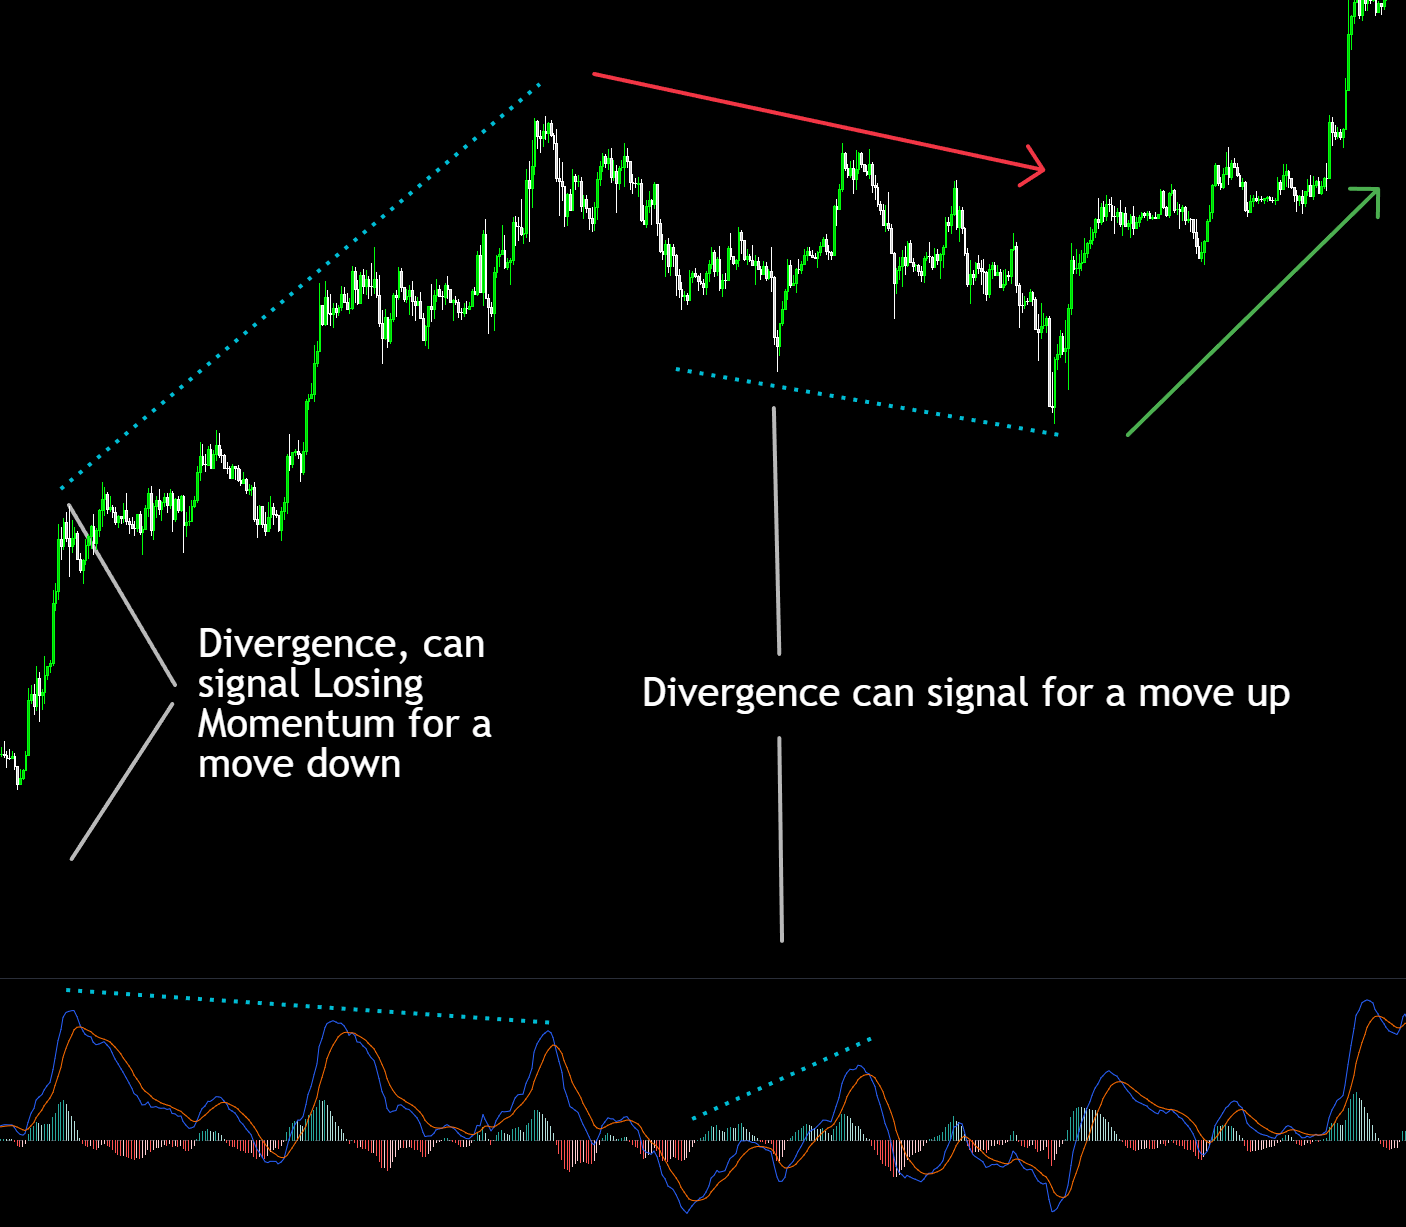
Bearish: price higher high, MACD lower high.
Bullish: price lower low, MACD higher low.
Use clear swing highs/lows for better signals.
What it means
Momentum is weakening even if price is still pushing.
Often leads to a pullback or a range before a bigger decision.
Best used with trend + a key level (support/resistance).
Common mistakes (avoid these)
- Shorting the first bearish divergence in a strong uptrend.
- Calling tiny moves divergence (noise).
- Ignoring that divergence can lead to a pullback, not a full reversal.
Why it’s useful
Helps spot momentum shifts earlier than price alone.
Helps manage risk (tighten stops / take partial profits).
Pairs well with levels to improve timing and confirmation.
Next step
Open the Dashboard, pick a stock, and try to explain what you see in one sentence. If you can explain it simply, you understand it.
RELATED LIVE SETUPS
Bullish & Bearish Divergence Stocks
Review live divergence setups currently being flagged across the market.
Oversold Stocks Today
Compare bullish divergence with oversold charts that may be approaching exhaustion.
Overbought Stocks Today
Compare bearish divergence with overextended charts that may be vulnerable to pullback.