Indicators
ATR (14)
A volatility measure — useful for stops and spotting ‘hot’ conditions.
How to use this lesson
Read it once, then open a chart and try to spot the same idea in 60 seconds. Repetition beats complexity.
What it is
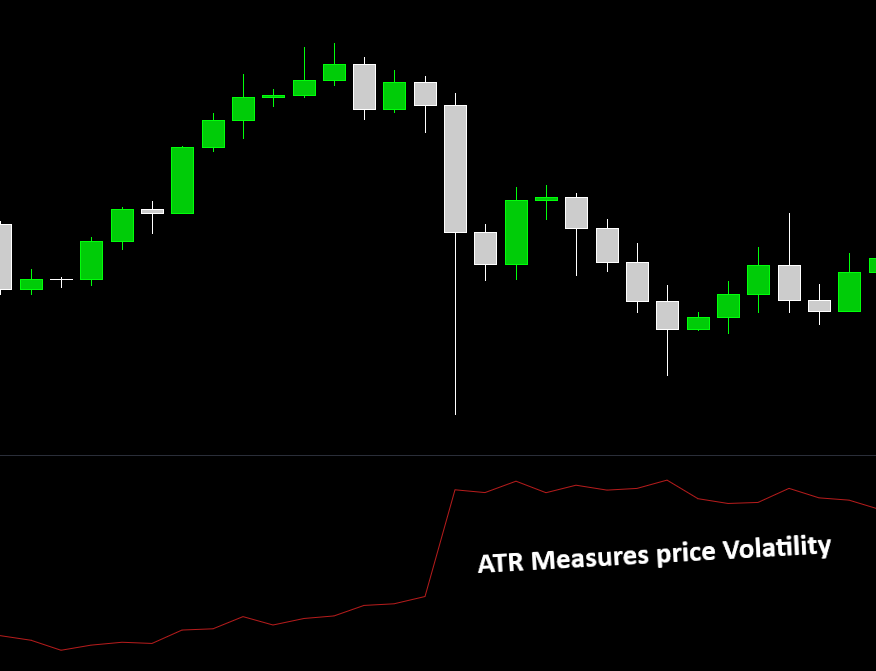
ATR (Average True Range) estimates how much price typically moves per bar.
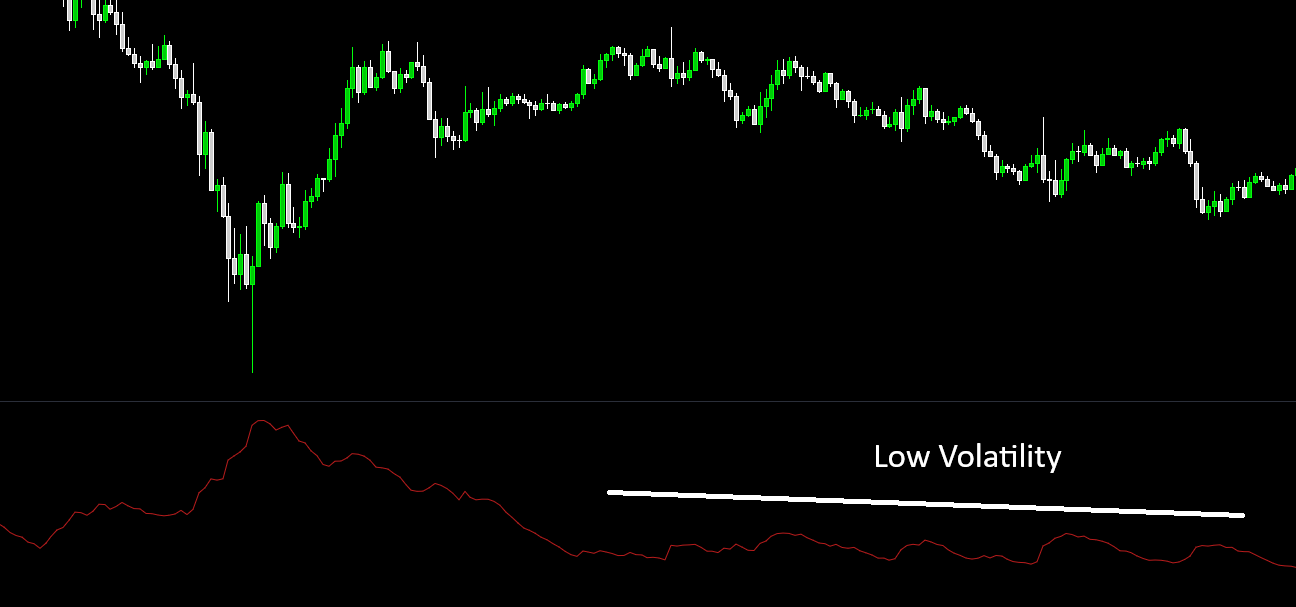
Higher ATR = more volatility. Lower ATR = quieter movement.
It does not tell direction — only how “active” price is.
How to identify it
Watch for ATR rising quickly: volatility is increasing.
Compare ATR to its recent average (is it unusually high or low?).
Use the same timeframe as your trade (ATR changes by timeframe).
What it means
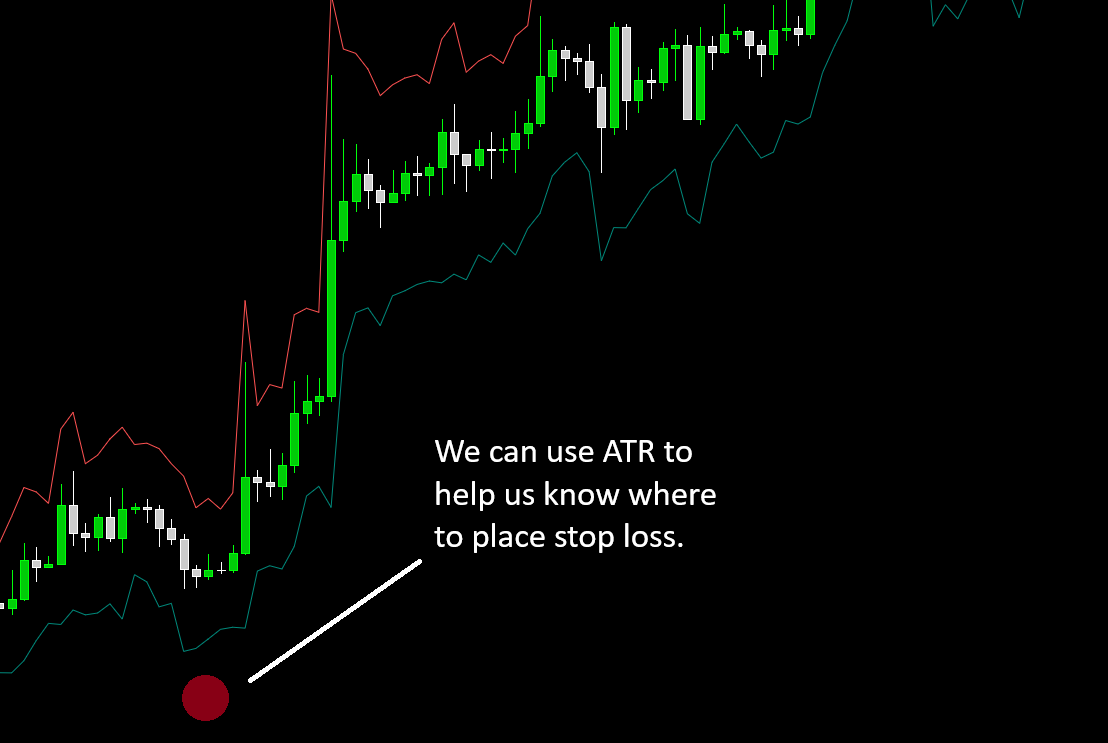
High ATR means bigger swings — stops may need more room.
Low ATR means smaller swings — moves may be slower and tighter.
Sudden ATR spikes can happen around news or breakouts.
Common mistakes (avoid these)
- Using ATR as a buy/sell signal (it’s not directional).
- Keeping the same stop size in all volatility regimes.
- Comparing ATR values across different timeframes without context.
Why it’s useful
Helps size stops based on current market volatility.
Helps avoid getting stopped out by normal noise.
Helps spot when conditions are unusually “hot” or unusually “quiet.”
Next step
Open the Dashboard, pick a stock, and try to explain what you see in one sentence. If you can explain it simply, you understand it.