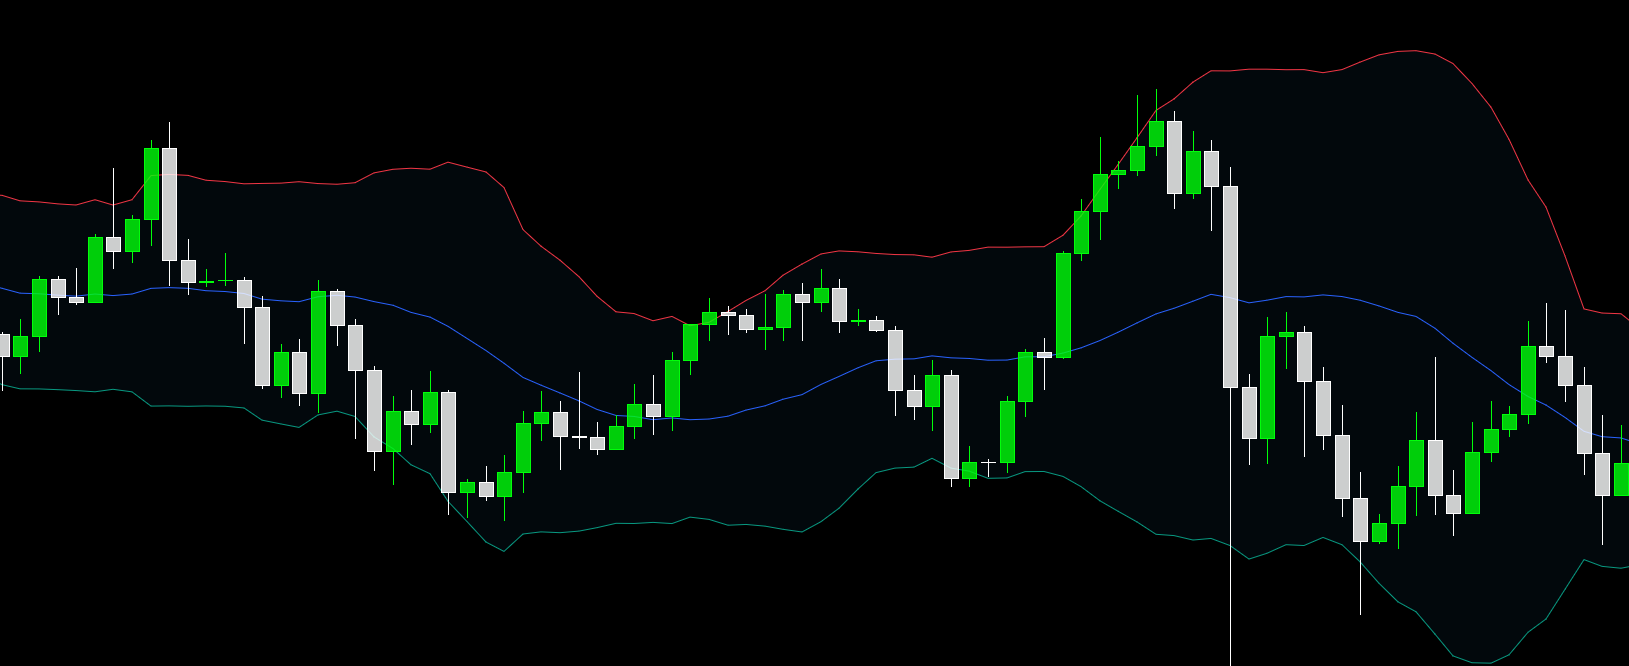
Bollinger Bands (20,2)
Bollinger Bands are a middle moving average (often 20) plus/minus volatility (standard deviation).
When volatility rises, the bands widen.
When volatility falls, the bands tighten.
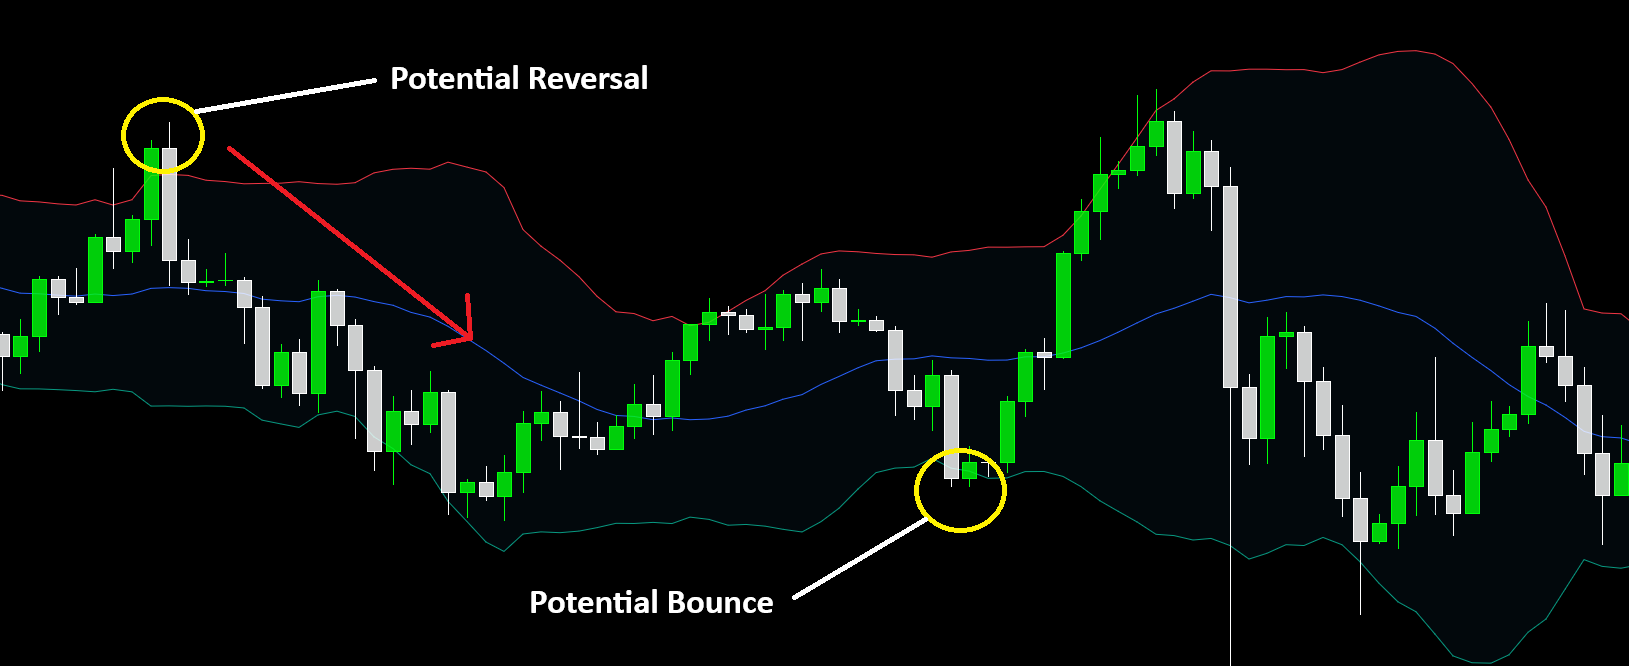
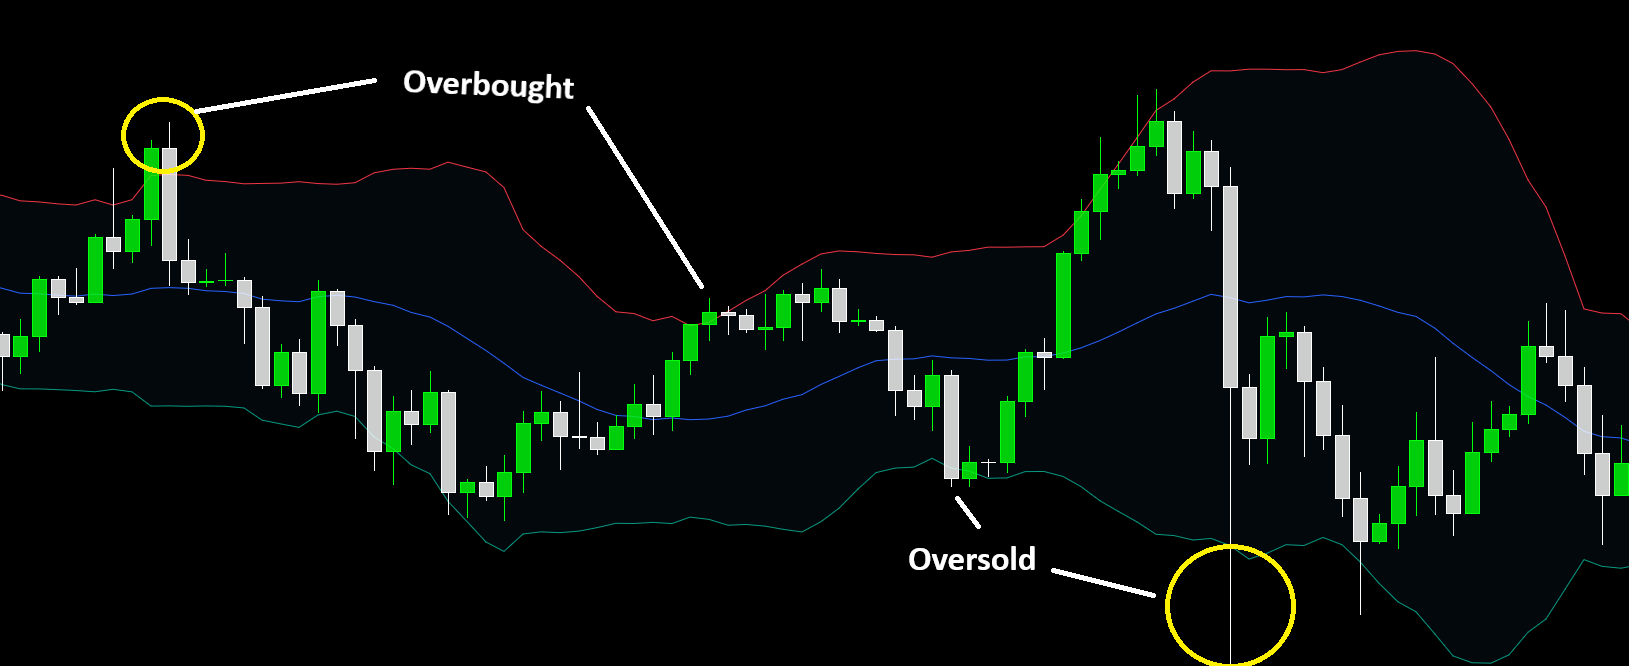
Price near the upper band can mean “extended” (not guaranteed reversal).
Price near the lower band can mean “extended” to the downside.
A very tight band (a squeeze) suggests volatility is low and may expand soon.
Touches can happen many times in strong trends (bands aren’t a hard ceiling).
Squeezes can precede a big move — direction still needs confirmation.
Mean-reversion traders look for reversion back toward the middle band.
- Selling every upper-band touch and buying every lower-band touch.
- Ignoring trend (bands behave differently in trends vs ranges).
- Assuming a squeeze predicts direction (it doesn’t).
Helps spot volatility expansion and contraction.
Helps identify stretched conditions (with context).
Helps visualize when price is moving unusually far from its average.