EMA (20)
EMA (Exponential Moving Average) is a smoothed price line that weights recent prices more.
It reacts faster than a simple moving average (SMA) of the same length.
EMA20 is commonly used as a trend/pullback reference.
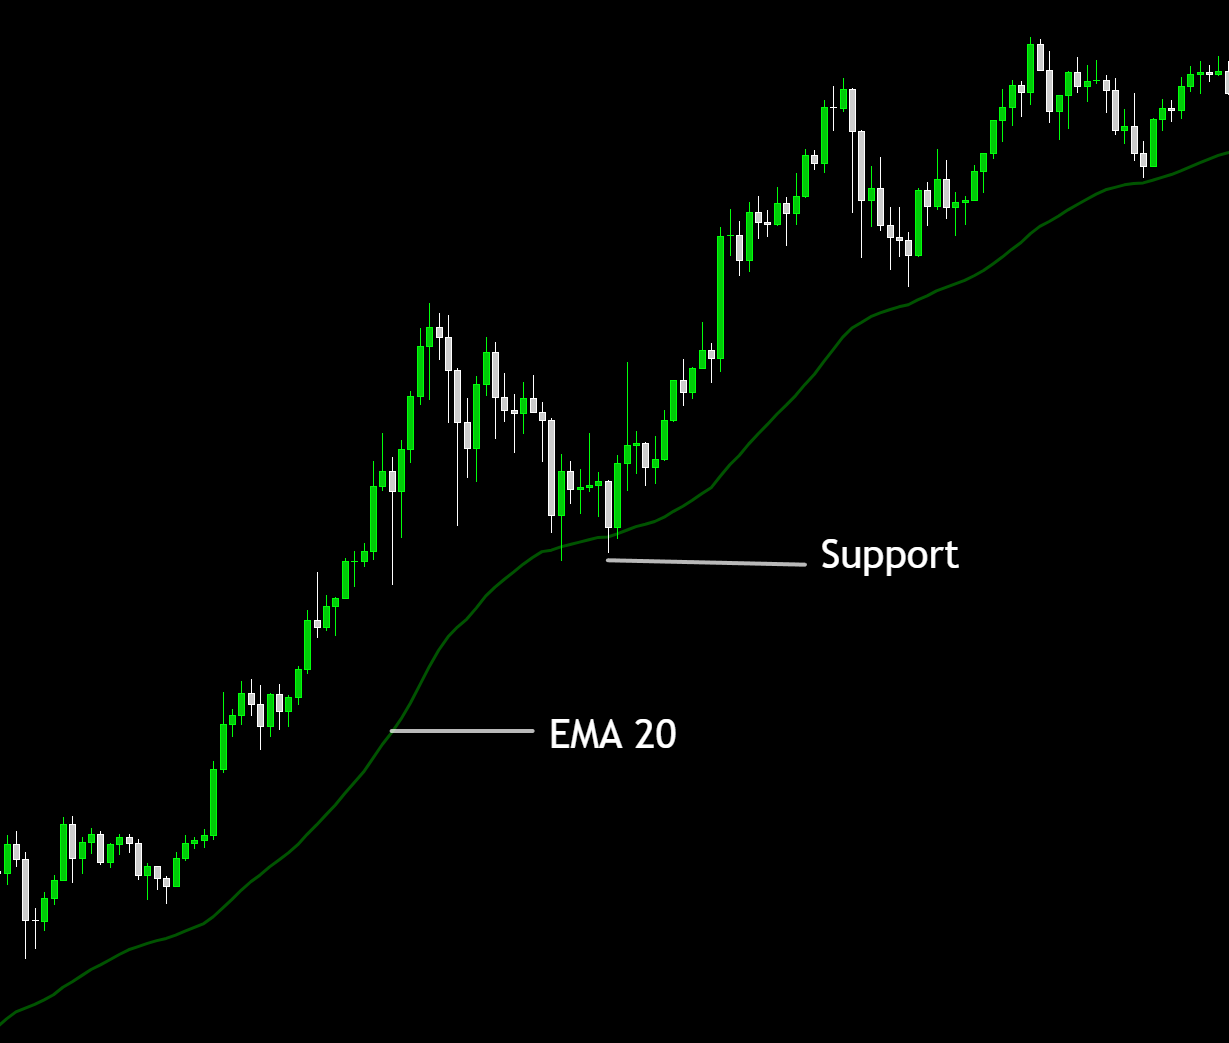
In uptrends, price often stays above EMA20 and pulls back toward it.
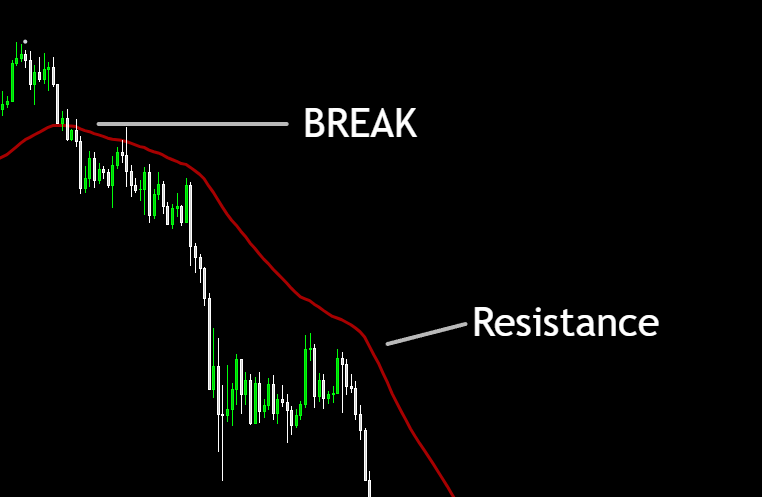
In downtrends, price often stays below EMA20 and rallies into it.
Repeated “respect” of EMA20 can make it act like dynamic support/resistance.
Holding above EMA20 often supports bullish momentum (context matters).
Breaking below EMA20 can signal momentum weakening or a deeper pullback.
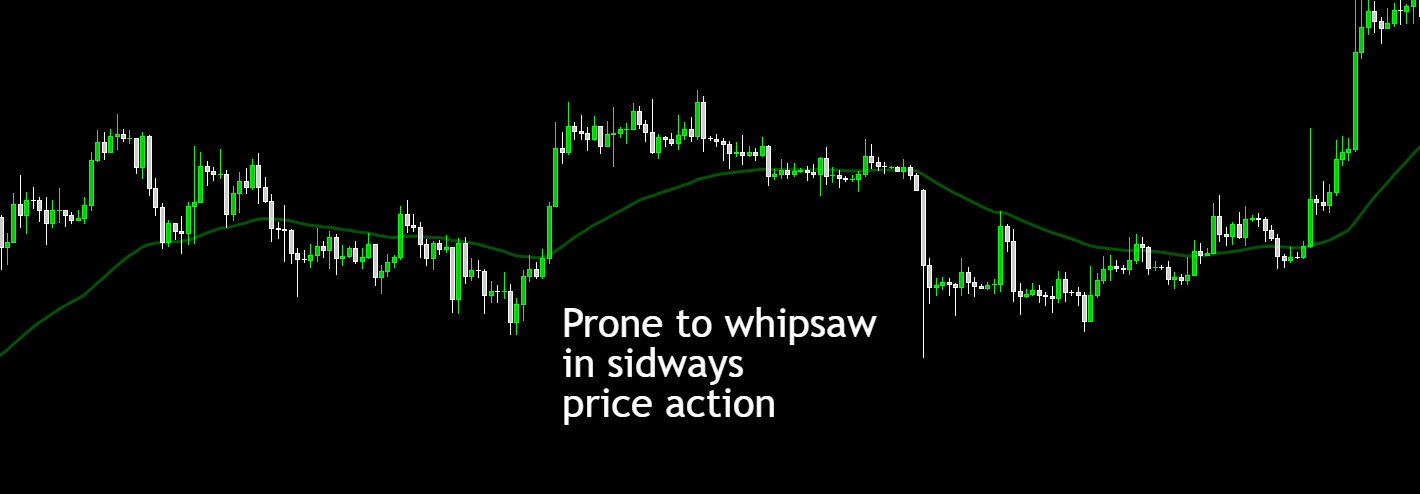
In choppy markets, EMA20 can whipsaw (many false signals).
- Using EMA20 alone as a buy/sell signal without trend context.
- Trading EMA crossovers on low timeframes and getting whipsawed.
- Assuming EMA20 is a “guaranteed bounce” level.
Helps quickly visualize short-term trend direction.
Helps spot pullbacks inside a trend.
Can help with trailing stops or dynamic support/resistance ideas.