MACD (12,26,9)
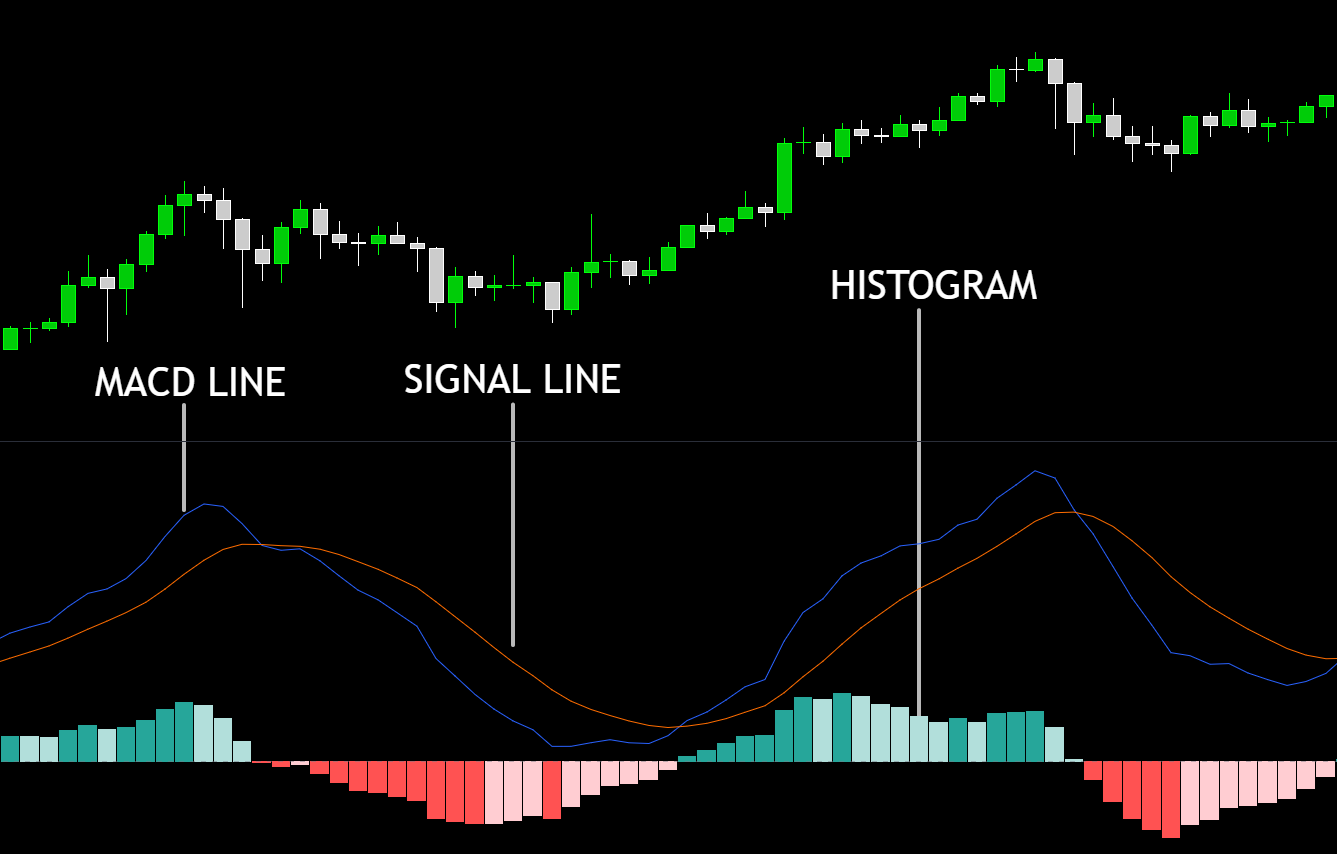
MACD compares a fast EMA and slow EMA to estimate momentum.
The histogram shows the gap between the MACD line and the signal line.
It’s commonly used to judge momentum shifts, not exact tops/bottoms.
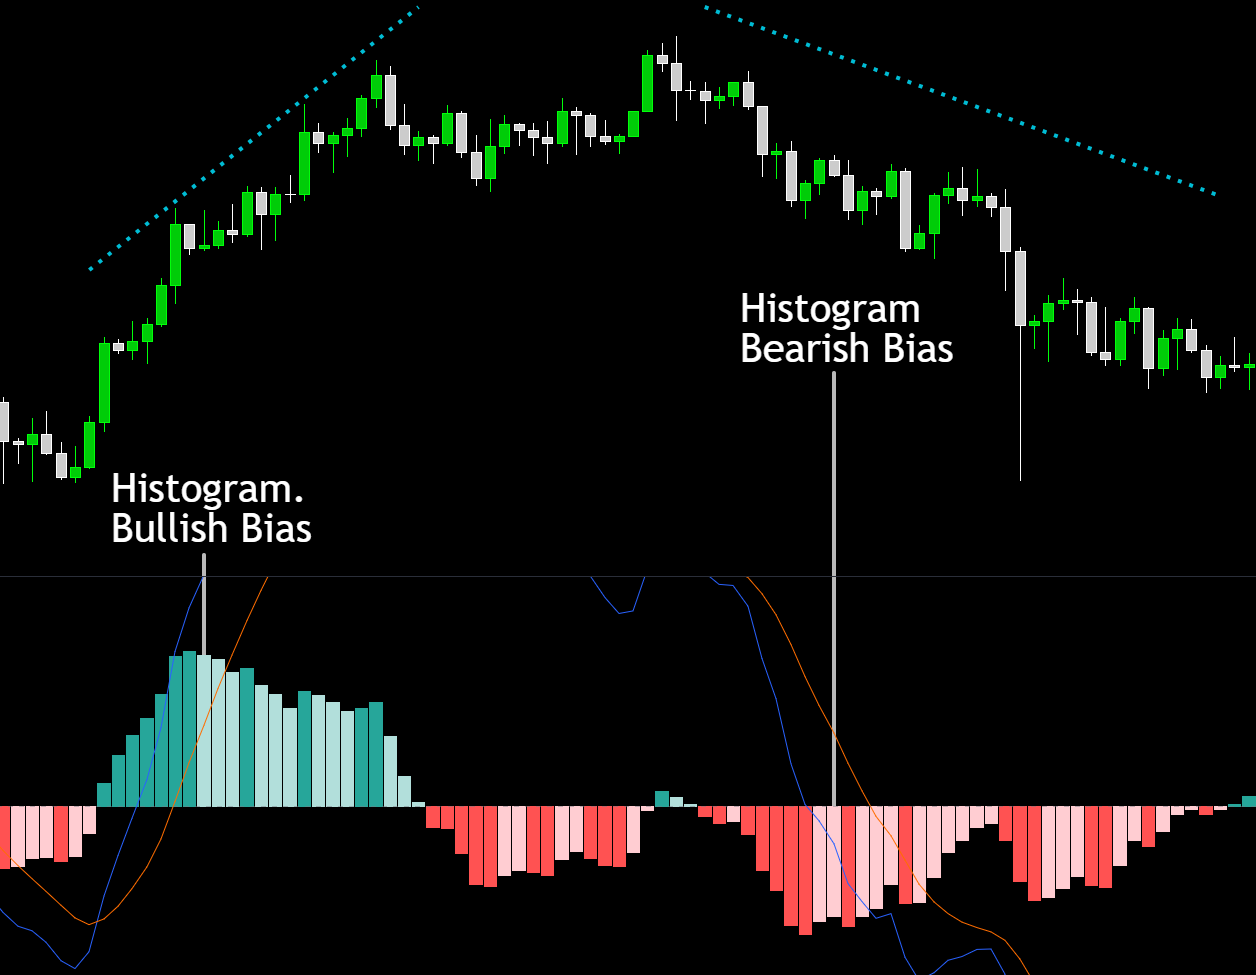
Histogram above zero = bullish momentum bias.
Histogram below zero = bearish momentum bias.
Watch histogram changes (rising vs falling) to see momentum strengthening or weakening.
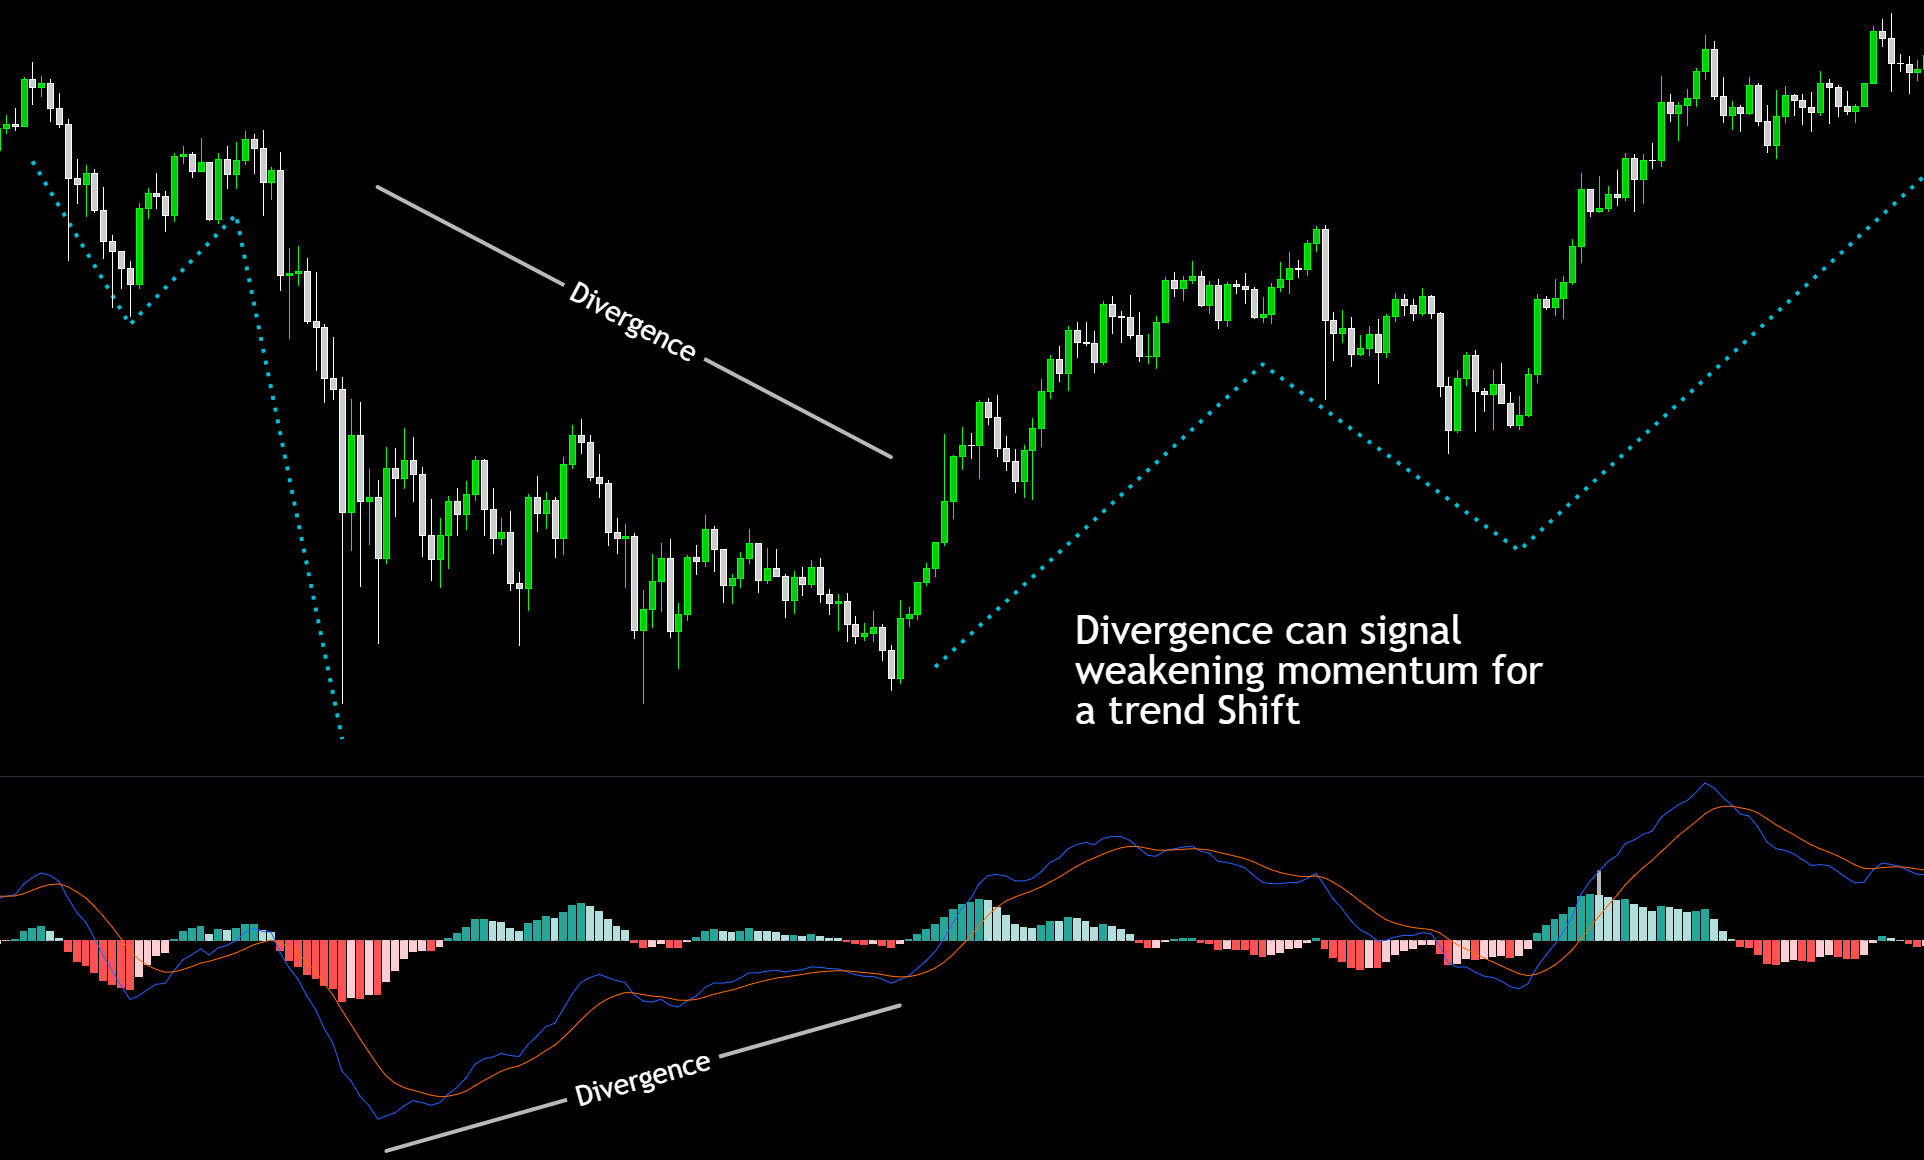
Momentum can weaken before price reverses (useful early warning).
In strong trends, MACD can stay positive or negative for long periods.
Divergence, where price keeps pushing but MACD does not, can hint that momentum is fading.
- Using MACD as a standalone buy/sell system.
- Overreacting to tiny histogram flips around zero.
- Ignoring trend context (MACD behaves differently in strong trends).
Helps spot momentum shifts earlier than price alone.
Helps confirm trend direction (positive or negative bias).
Helps identify divergence and possible weakening in otherwise strong-looking moves.