Moving Averages (MA50 / MA200)
A moving average is a smoothed line of price over a set number of bars.
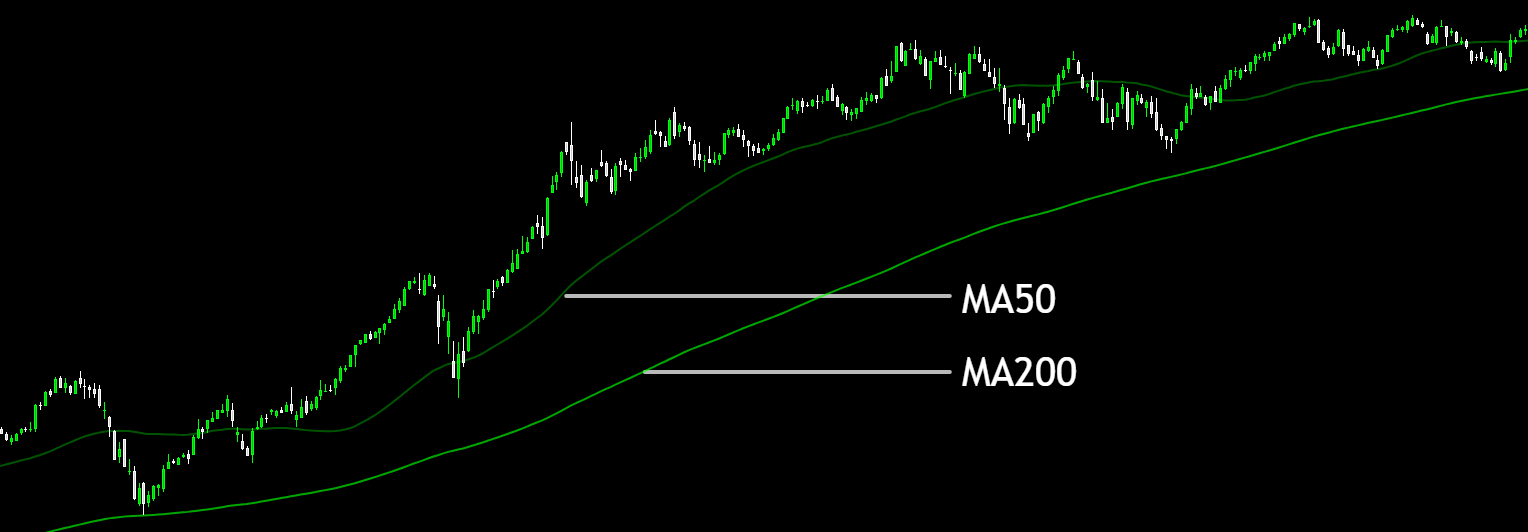
MA50 reacts faster than MA200 because it uses fewer bars.
MA200 is often used as a long-term trend filter.
Price above MA200 often suggests long-term bullish bias (not a rule).
Price below MA200 often suggests long-term bearish bias.
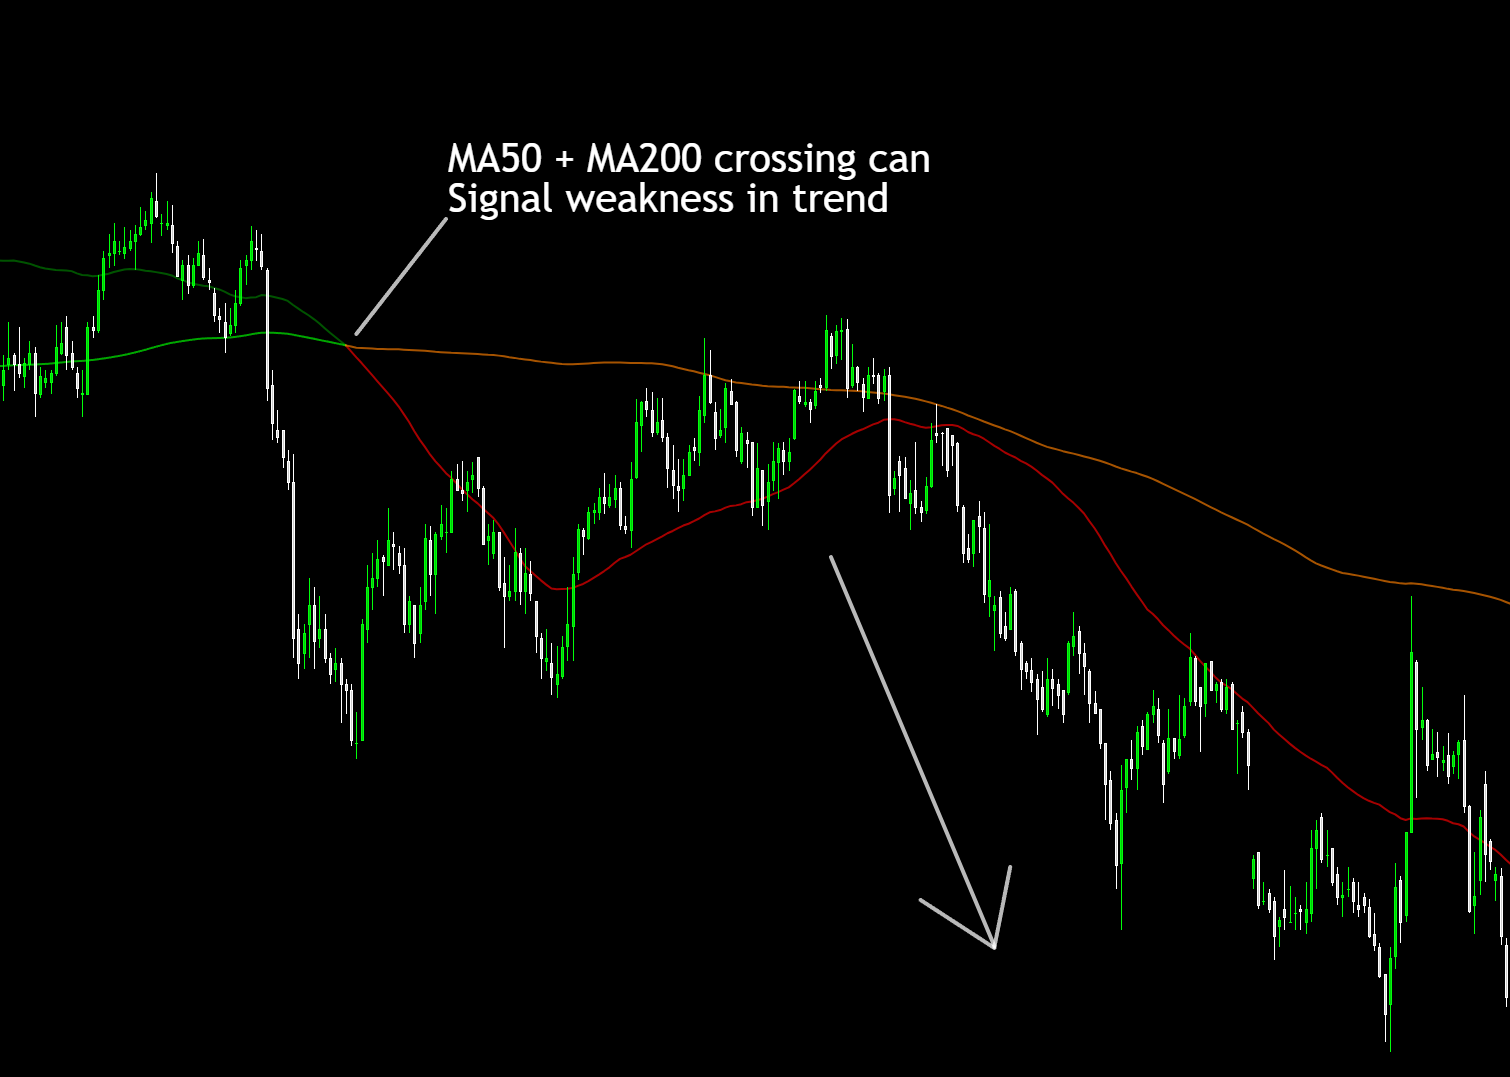
MA50 crossing MA200 is a popular signal, but it reacts after much of the move has already happened.
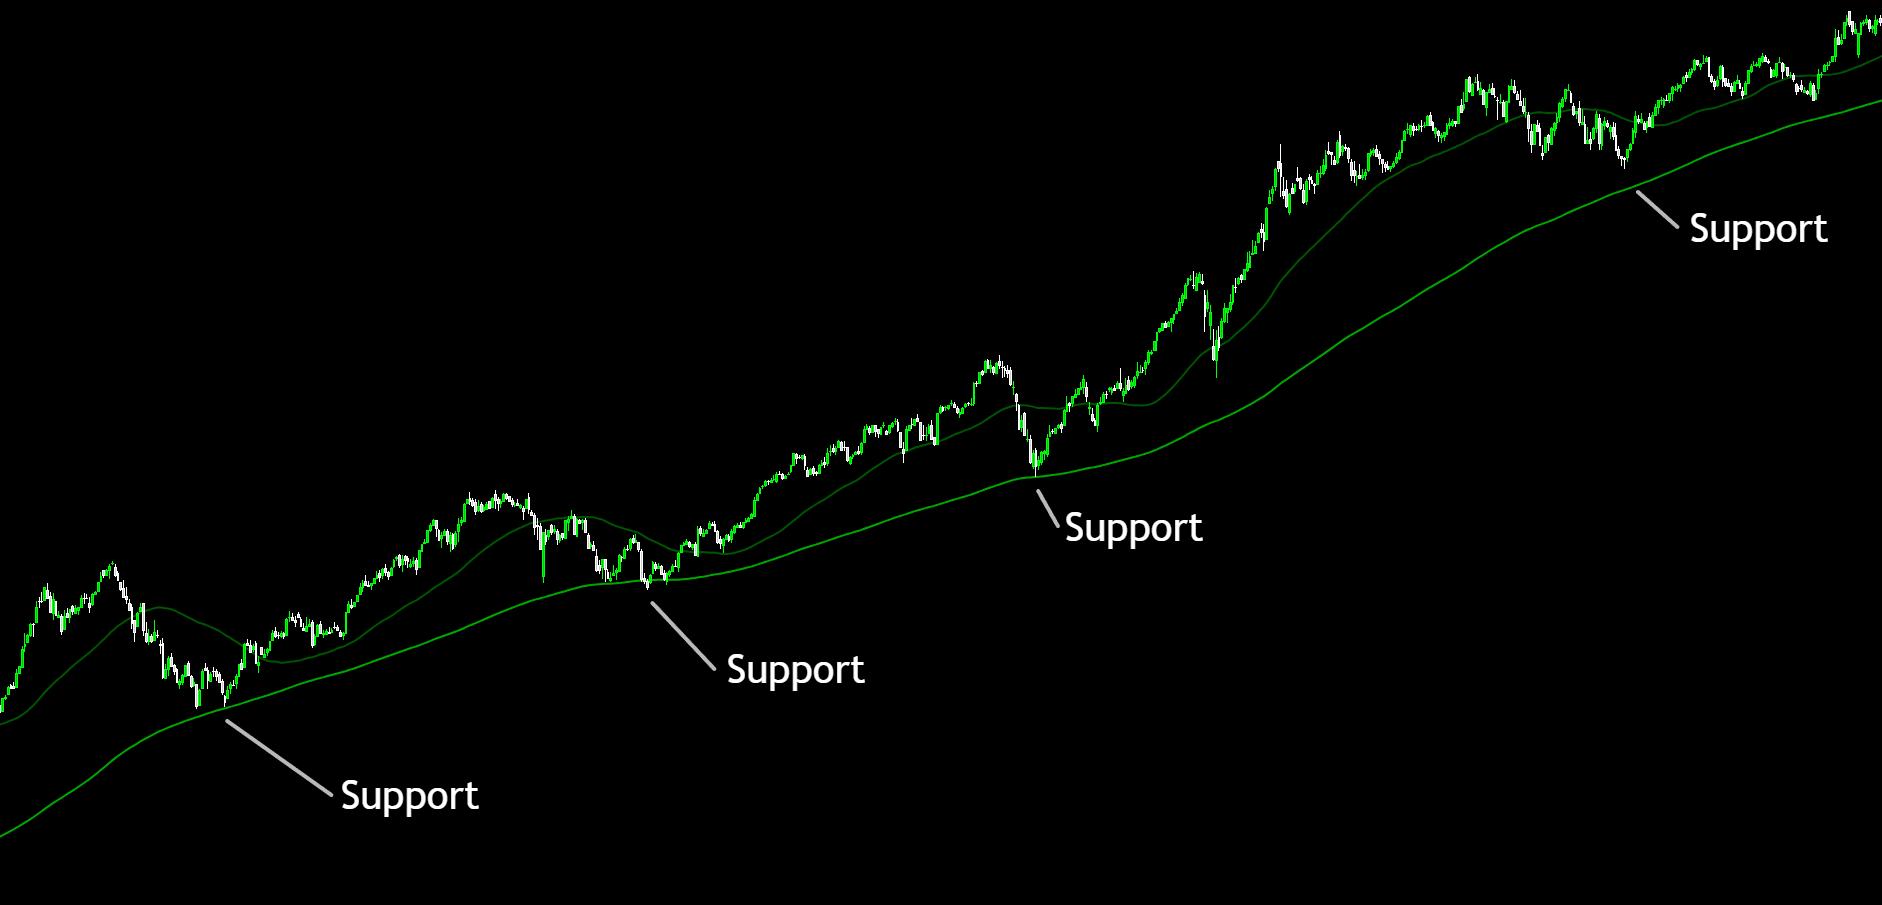
Moving averages can act like dynamic support and resistance zones.
A strong trend often respects MA50 or MA200 during pullbacks.
The 200-day moving average is widely watched and can act as a key long-term decision level.
- Buying/selling purely because price crossed an average once.
- Treating MA lines as exact and ignoring zones.
- Using moving averages in choppy ranges (lots of false signals).
Helps quickly identify long-term trend direction.
Helps map likely pullback areas in trending markets.
Helps highlight key levels like MA200 that many traders monitor for reactions.