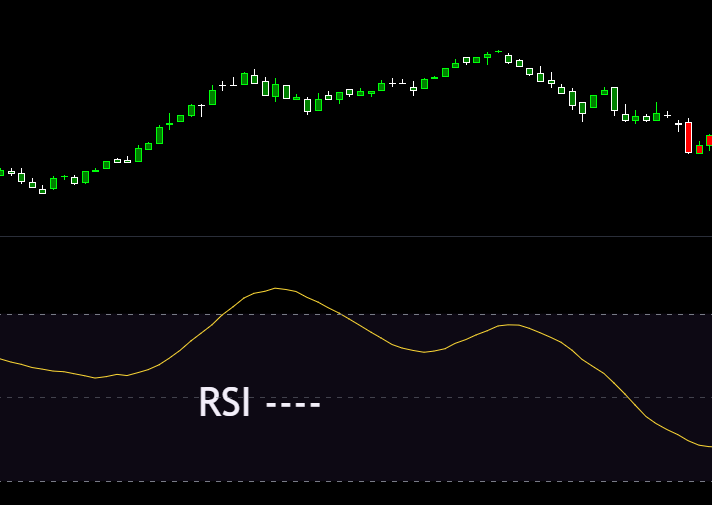
RSI (14)
RSI (Relative Strength Index) is a momentum oscillator from 0 to 100.
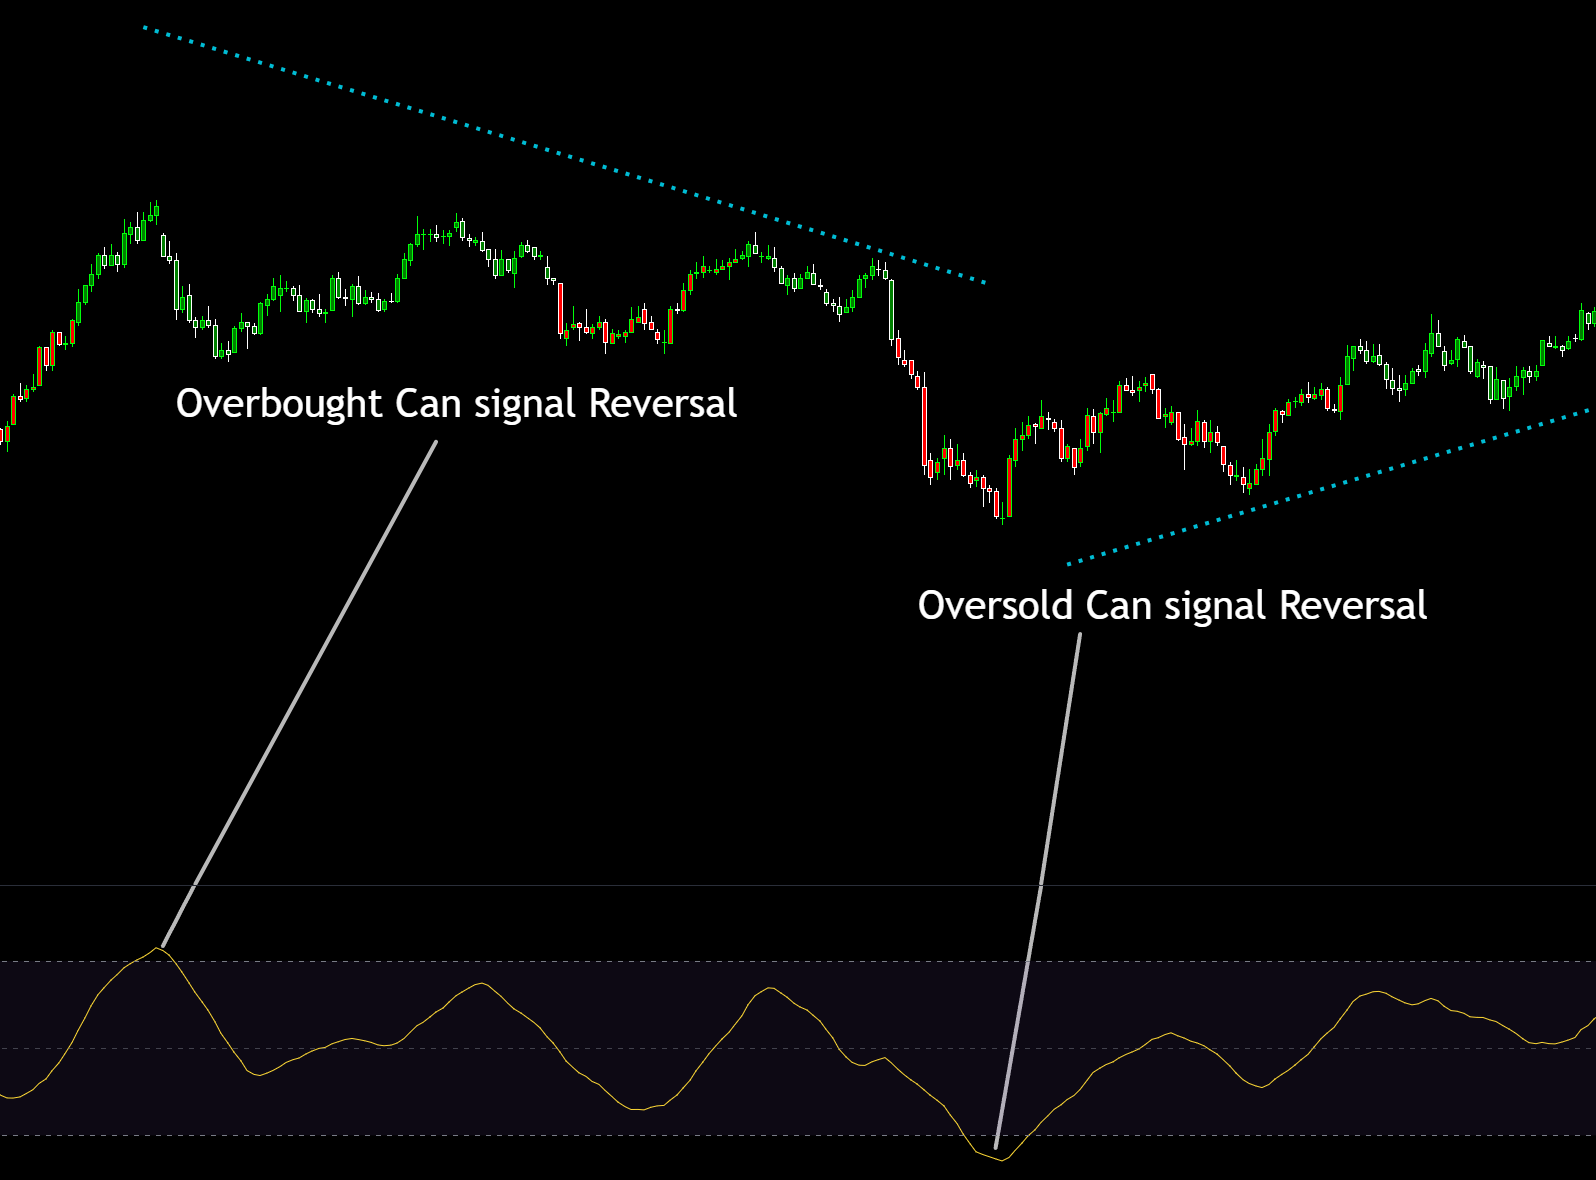
RSI above ~70 is often called overbought; below ~30 is often oversold.
It measures speed/strength of recent moves — not “value.”
RSI near/above 70 can signal stretched upside momentum and often appears in overbought conditions.
RSI near/below 30 can signal stretched downside momentum and often appears in oversold conditions.
In strong trends, RSI can stay high or low for a long time.
Overbought doesn’t mean “must sell” — it can mean strong trend.
Oversold doesn’t mean “must buy” — it can mean strong downtrend.
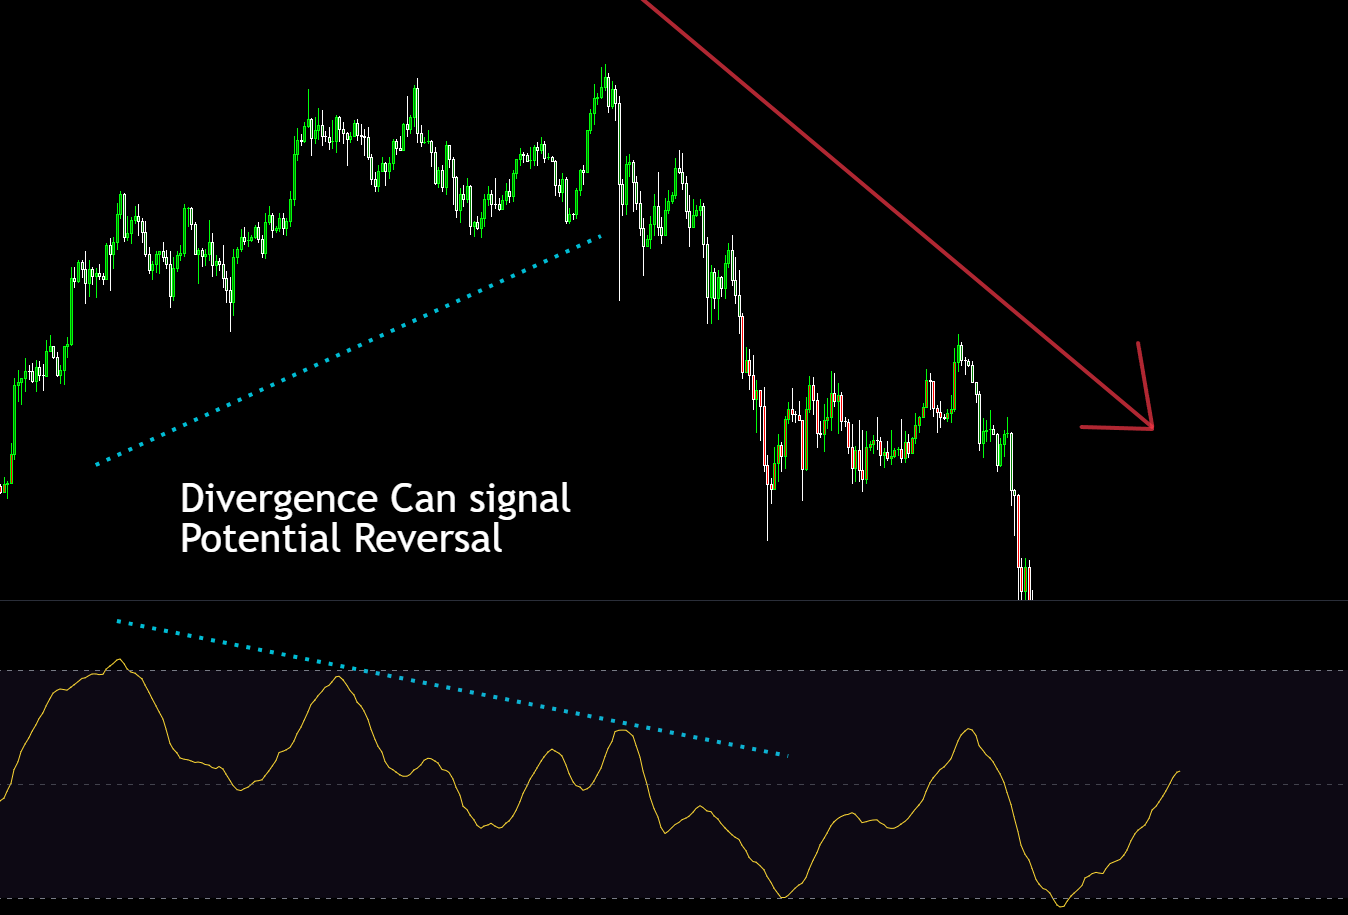
RSI divergence can warn momentum is weakening and may sometimes appear before a reversal setup develops.
- Shorting just because RSI is above 70 in a strong uptrend.
- Buying just because RSI is below 30 in a strong downtrend.
- Using RSI alone without trend + levels.
Helps spot stretched momentum conditions.
Helps confirm trend strength (RSI tends to stay elevated in uptrends).
Helps identify overbought, oversold, and divergence conditions that traders often monitor closely.