Indicators
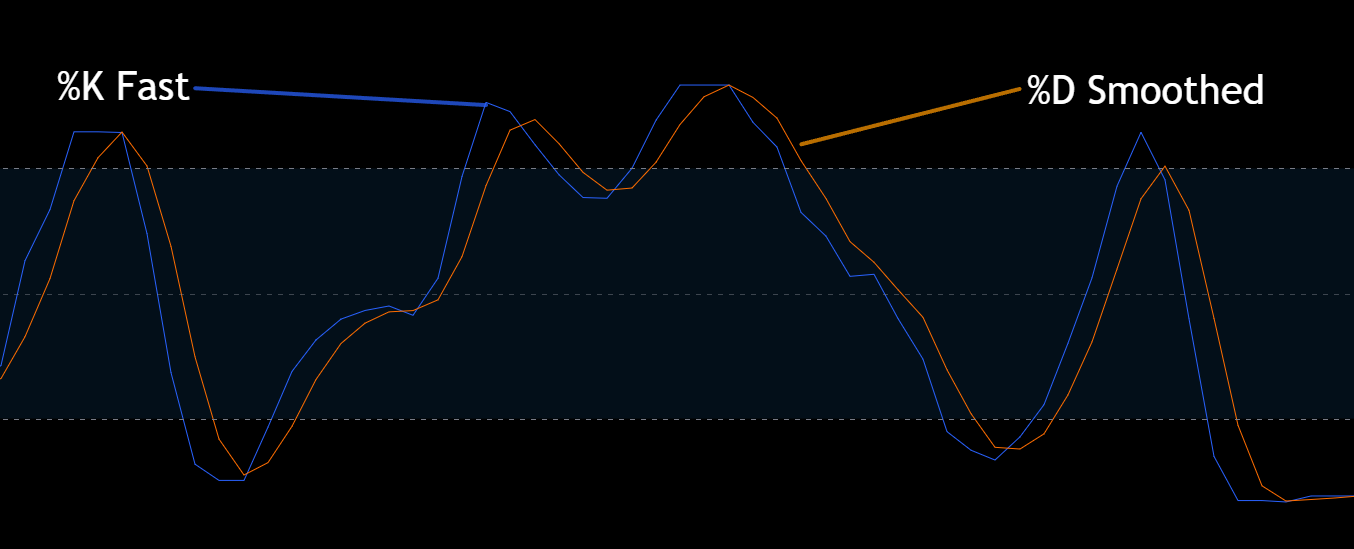
Stochastic (14,3)
Oscillator that compares close vs recent range — often used for momentum extremes.
How to use this lesson
Read it once, then open a chart and try to spot the same idea in 60 seconds. Repetition beats complexity.
What it is
Stochastic compares the close to the recent high/low range over a lookback window.
It’s often shown as %K (fast) and %D (smoothed).
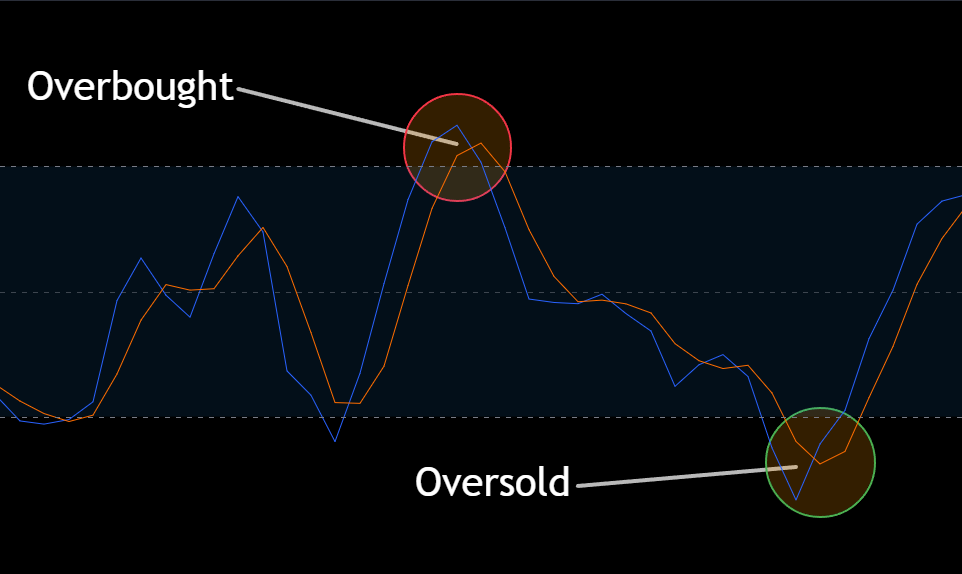
Like RSI, it’s used to spot momentum extremes.
How to identify it
%K above ~80 is often called overbought; below ~20 is oversold.
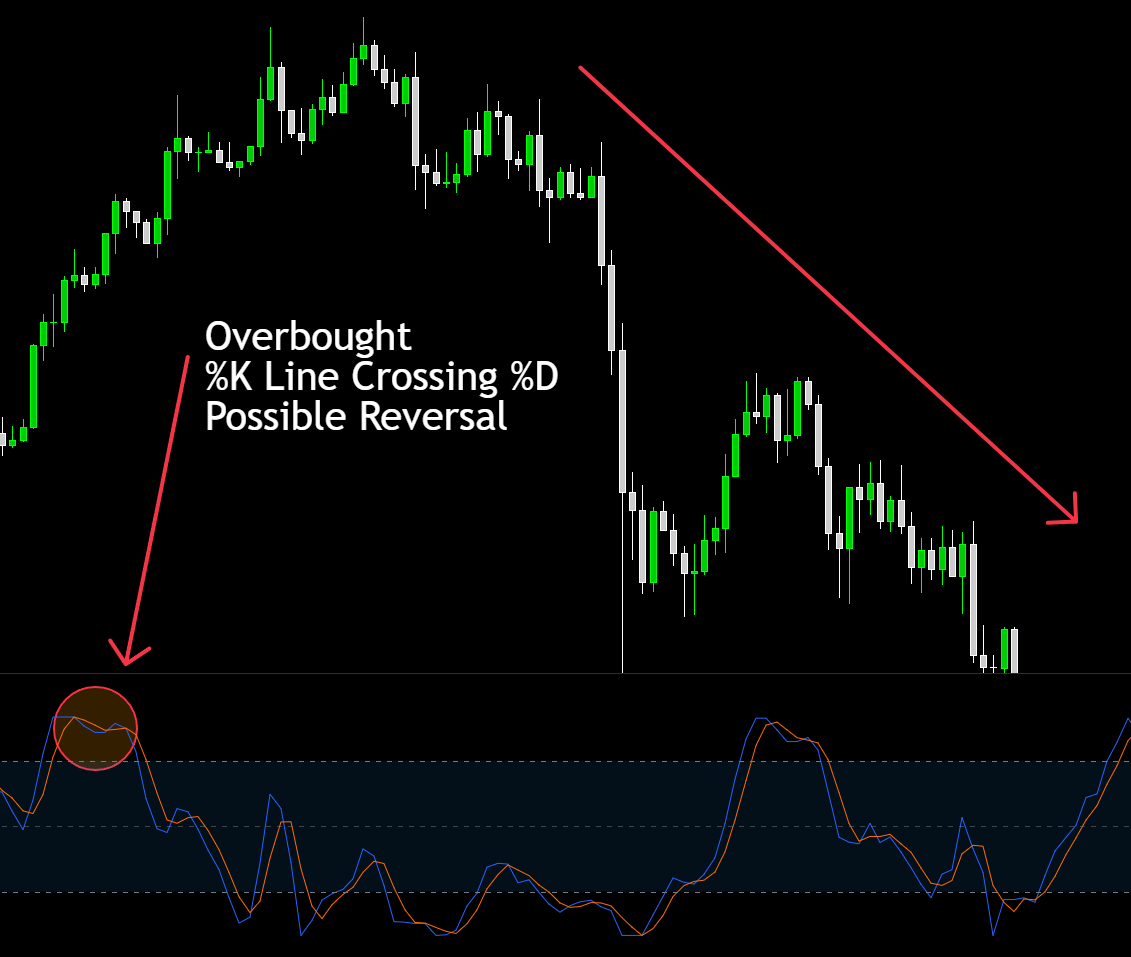
Crosses of %K and %D can hint momentum shifts (not guaranteed).
In strong trends, it can stay pinned near extremes.
What it means
Overbought/oversold can mean “strong trend” rather than “reversal.”
Momentum shifts matter more when they align with trend + levels.
Divergence between price and Stoch can also occur (similar idea to RSI).
Common mistakes (avoid these)
- Buying/selling every overbought/oversold reading.
- Ignoring trend (most oscillator losses come from fighting trends).
- Over-trading tiny crosses on low timeframes.
Why it’s useful
Helps spot stretched momentum and possible pullbacks.
Helps time entries better in ranges when used with support/resistance.
Provides a second view of momentum similar to RSI.
Next step
Open the Dashboard, pick a stock, and try to explain what you see in one sentence. If you can explain it simply, you understand it.