Indicators
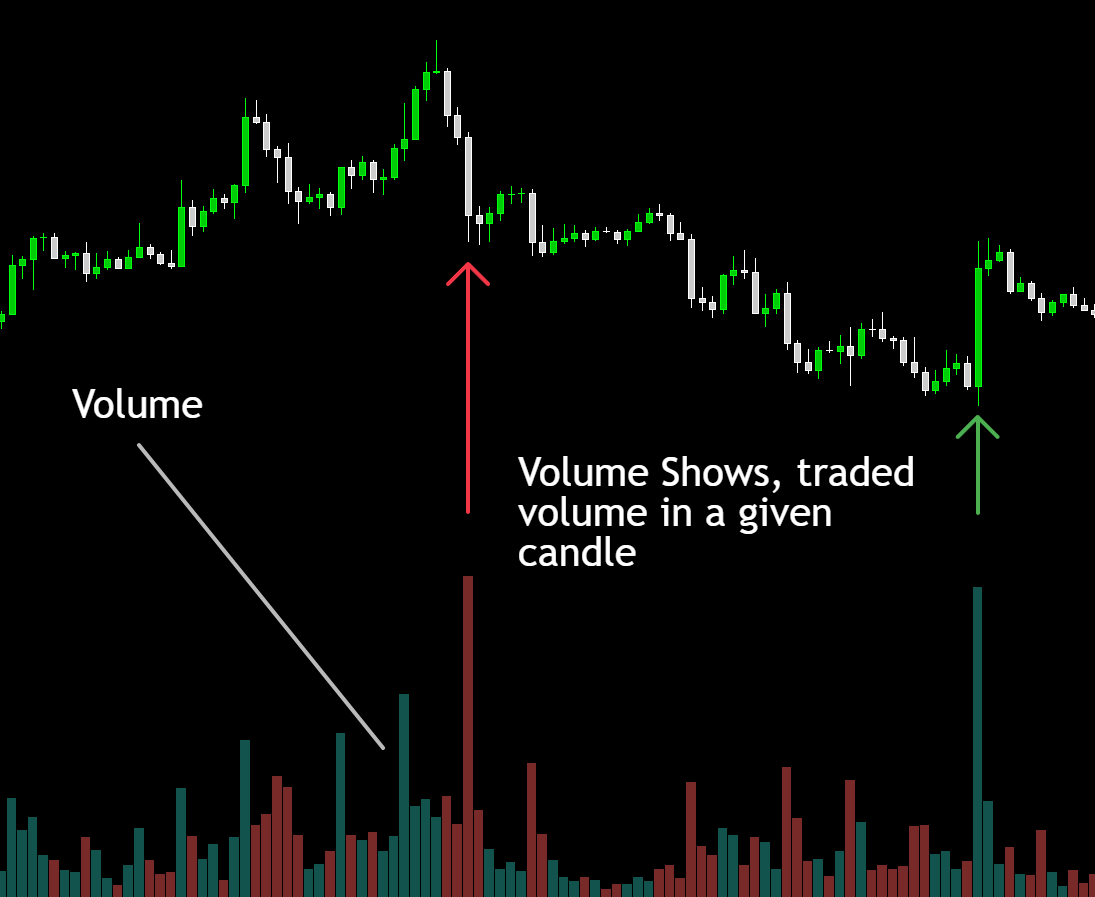
Volume
How much traded can confirm moves and warn on weak breakouts.
How to use this lesson
Read it once, then open a chart and try to spot the same idea in 60 seconds. Repetition beats complexity.
What it is
Volume is how much was traded during a bar (day/week/etc.).
Higher volume means more participation.
Lower volume means fewer participants and often weaker conviction.
How to identify it
Compare current volume to a recent average (like 20-bar average).
Breakouts with higher-than-usual volume are typically more credible.
Low-volume breakouts can fail more often (but not always).
What it means
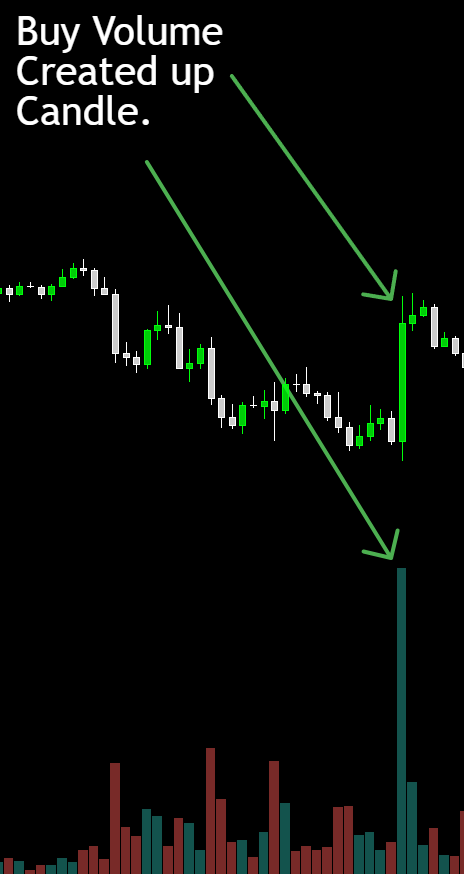
High volume can confirm interest behind a move.
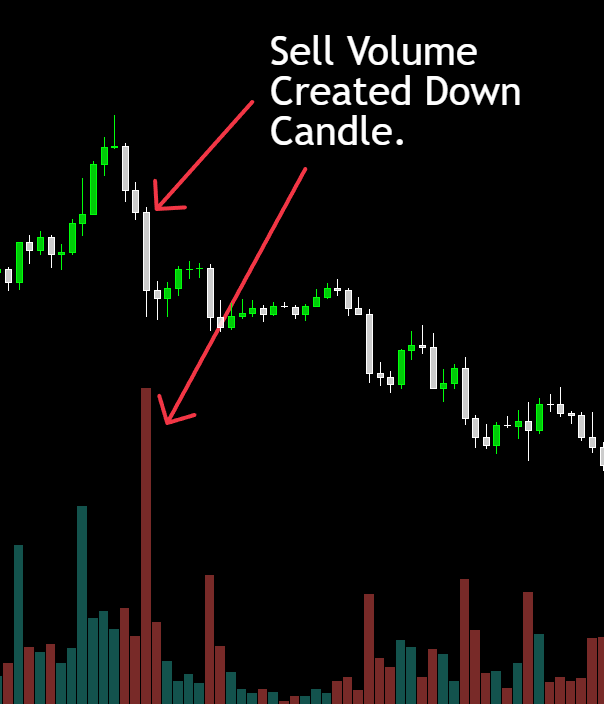
Low volume can mean a move is fragile or easily reversed.
Spikes can happen around news, earnings, or major breakouts.
Common mistakes (avoid these)
- Assuming high volume always means bullish (it can be selling too).
- Ignoring context (volume meaning changes at levels and breakouts).
- Comparing volume across very different symbols without context.
Why it’s useful
Helps confirm breakouts and breakdowns.
Helps spot unusual activity.
Adds context to price moves (strong vs weak participation).
Next step
Open the Dashboard, pick a stock, and try to explain what you see in one sentence. If you can explain it simply, you understand it.