Indicators
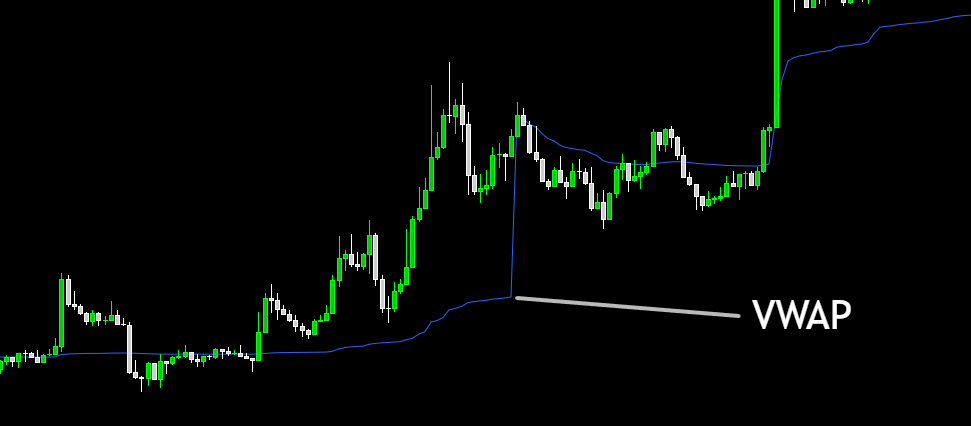
VWAP
A volume-weighted average price — often treated like a ‘fair value’ reference.
How to use this lesson
Read it once, then open a chart and try to spot the same idea in 60 seconds. Repetition beats complexity.
What it is
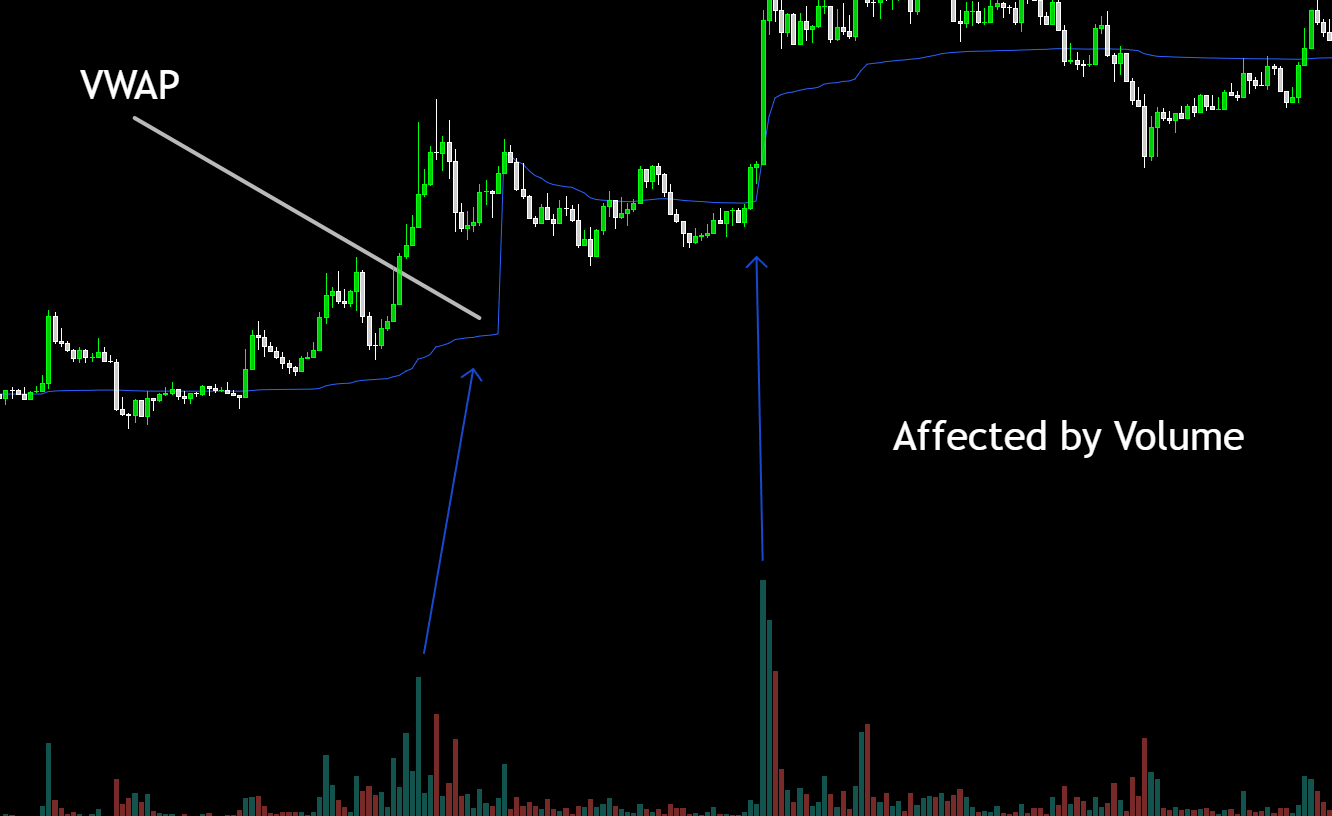
VWAP is the average price weighted by volume (more volume = more influence).
It’s most common intraday; on daily data it’s a rough reference.
Many traders treat VWAP like a ‘fair price’ anchor.
How to identify it
Price above VWAP often suggests buyers are in control (context matters).
Price below VWAP often suggests sellers are in control.
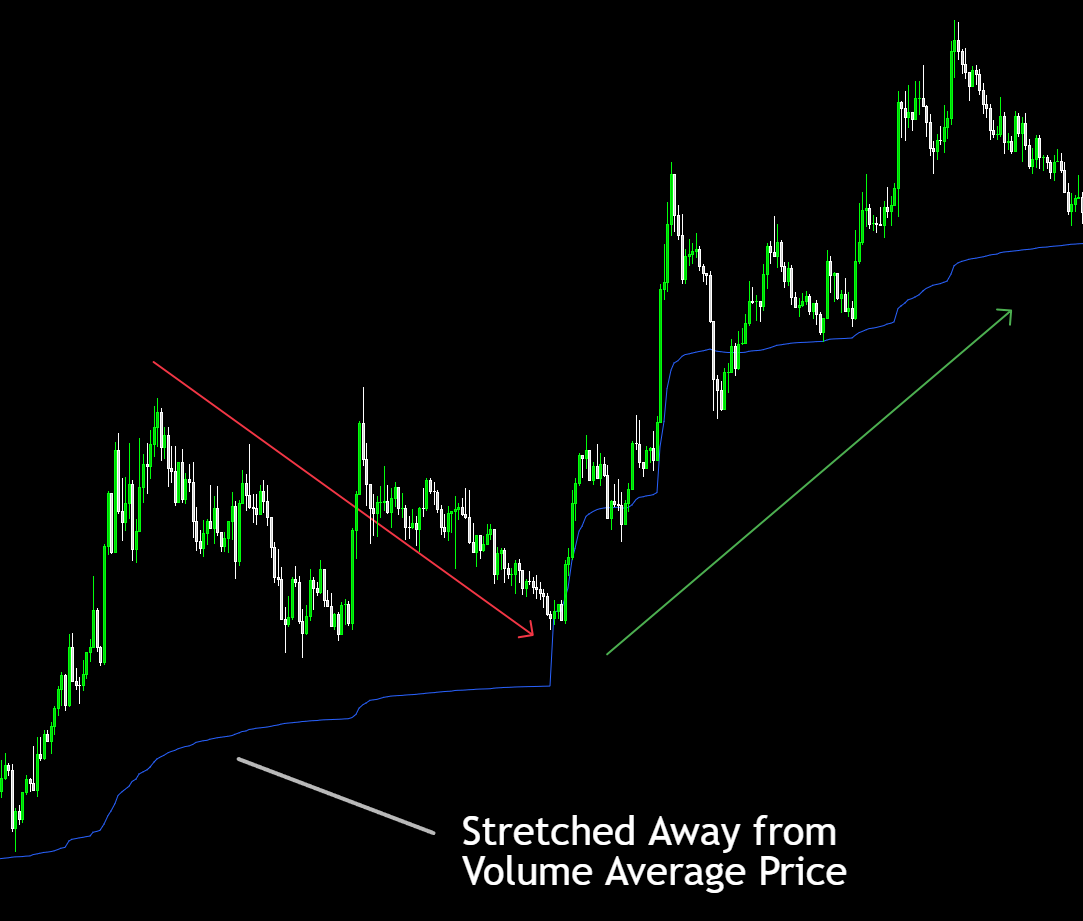
Large distance from VWAP can signal ‘stretched’ conditions.
What it means
Mean reversion traders watch for price to return toward VWAP.
Trend traders may prefer being on the same side as VWAP.
VWAP isn’t magic — it’s a reference point, not a guarantee.
Common mistakes (avoid these)
- Using VWAP as a guaranteed bounce/reversal line.
- Ignoring trend (price can stay far from VWAP in strong trends).
- Overfitting rules to VWAP without considering the bigger chart context.
Why it’s useful
A simple “fair price” reference to judge if price is stretched.
Helps frame bias (above vs below) in active markets.
Pairs well with support/resistance and trend context.
Next step
Open the Dashboard, pick a stock, and try to explain what you see in one sentence. If you can explain it simply, you understand it.