Divergencies
RSI Divergence
When price and RSI disagree — often a warning that momentum is weakening.
How to use this lesson
Read it once, then open a chart and try to spot the same idea in 60 seconds. Repetition beats complexity.
What it is
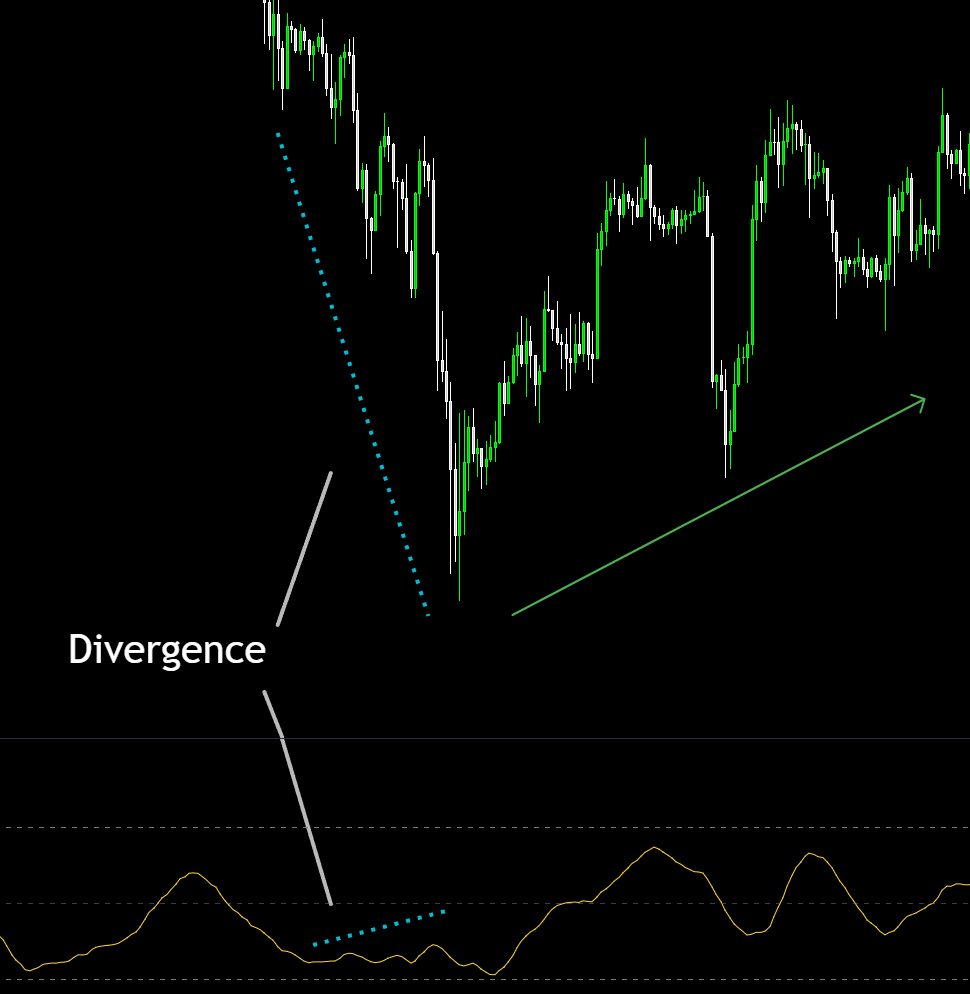
Divergence is when price makes a new high/low, but RSI does not.
It can be an early warning that the current move is losing strength.
It’s a clue, not a guaranteed reversal signal.
How to identify it
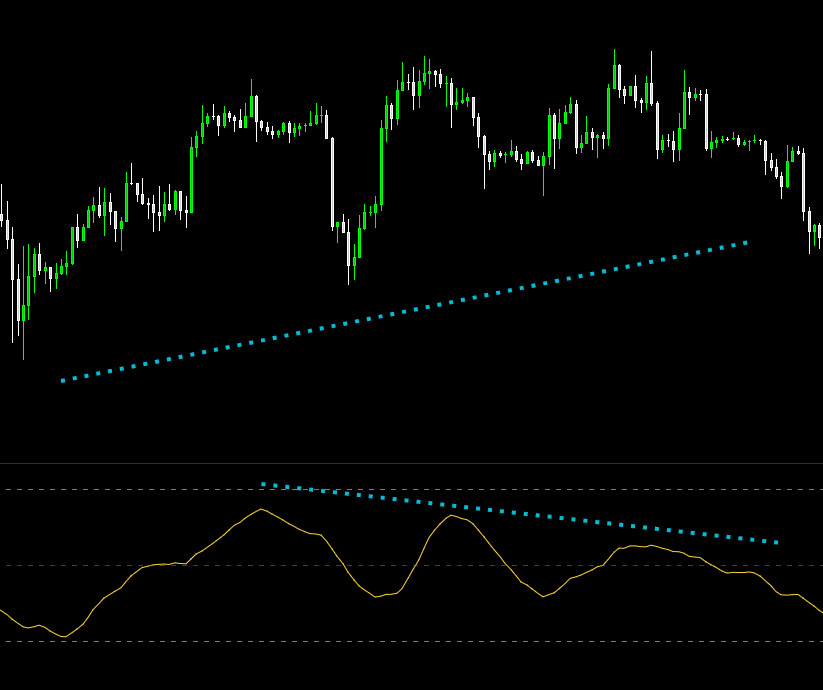
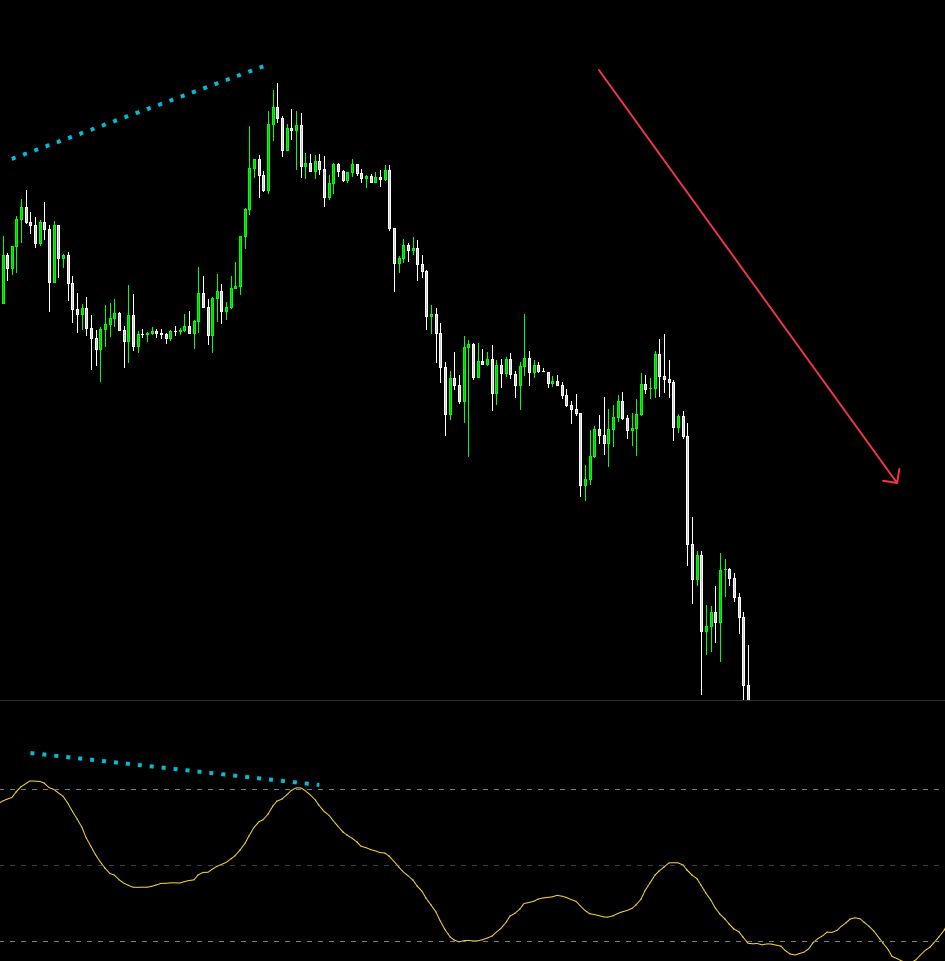
Bearish: price makes a higher high, RSI makes a lower high.
Bullish: price makes a lower low, RSI makes a higher low.
Look for clear swing highs/lows (not tiny wiggles).
What it means
Momentum is not confirming the new price extreme.
The trend may slow, pull back, or reverse (context decides).
Divergence is stronger near major support/resistance levels.
Common mistakes (avoid these)
- Treating divergence as an automatic reversal trade.
- Using very small swings (noise) and calling it divergence.
- Ignoring the bigger trend (divergence can fail in strong trends).
Why it’s useful
Helps spot weakening momentum before price clearly turns.
Helps plan risk (tighten stops when momentum fades).
Pairs well with levels for higher-quality setups.
Next step
Open the Dashboard, pick a stock, and try to explain what you see in one sentence. If you can explain it simply, you understand it.
RELATED LIVE SETUPS
Bullish & Bearish Divergence Stocks
Review live divergence setups currently being flagged across the market.
Oversold Stocks Today
Compare bullish divergence with oversold charts that may be approaching exhaustion.
Overbought Stocks Today
Compare bearish divergence with overextended charts that may be vulnerable to pullback.