How to Identify Stock Trends
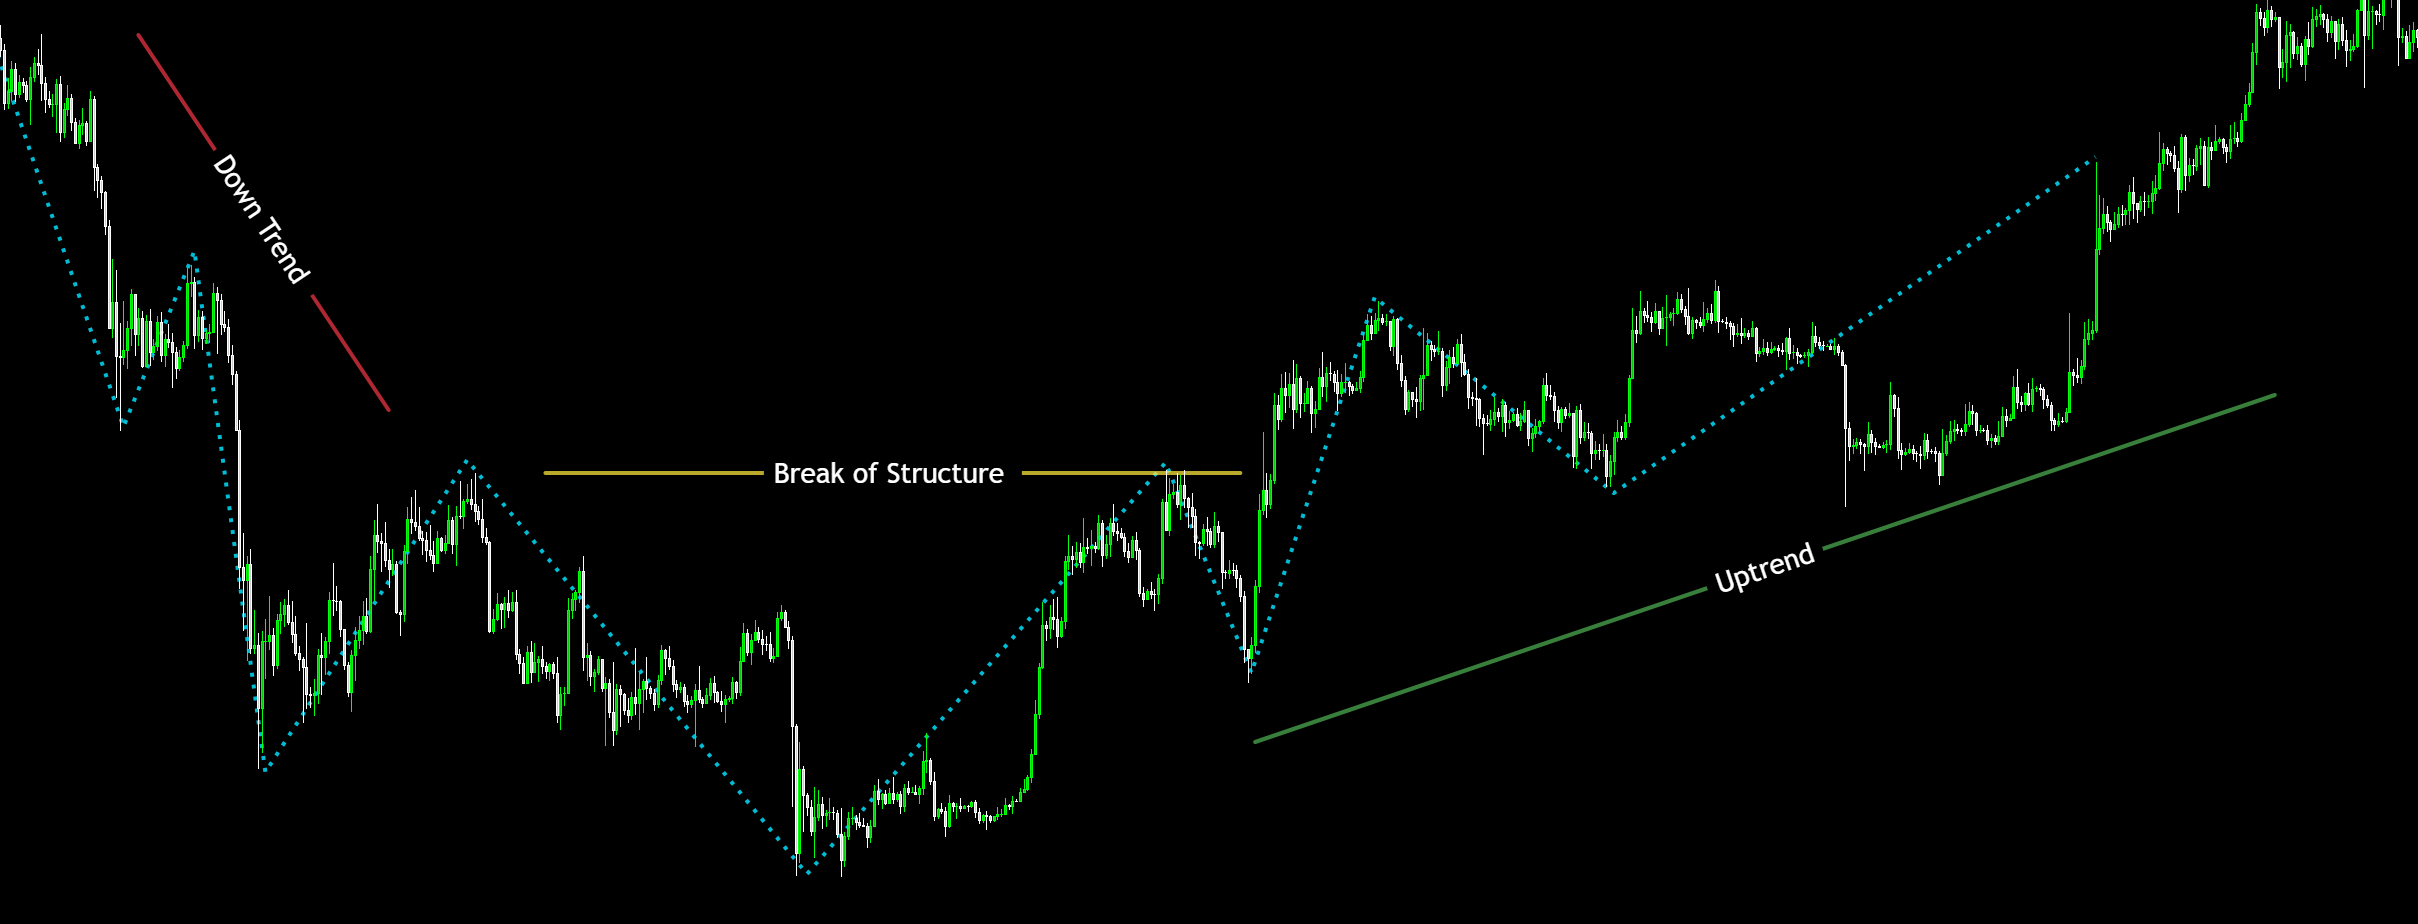
Trend is the overall direction price is moving over time.
An uptrend usually means higher highs and higher lows.
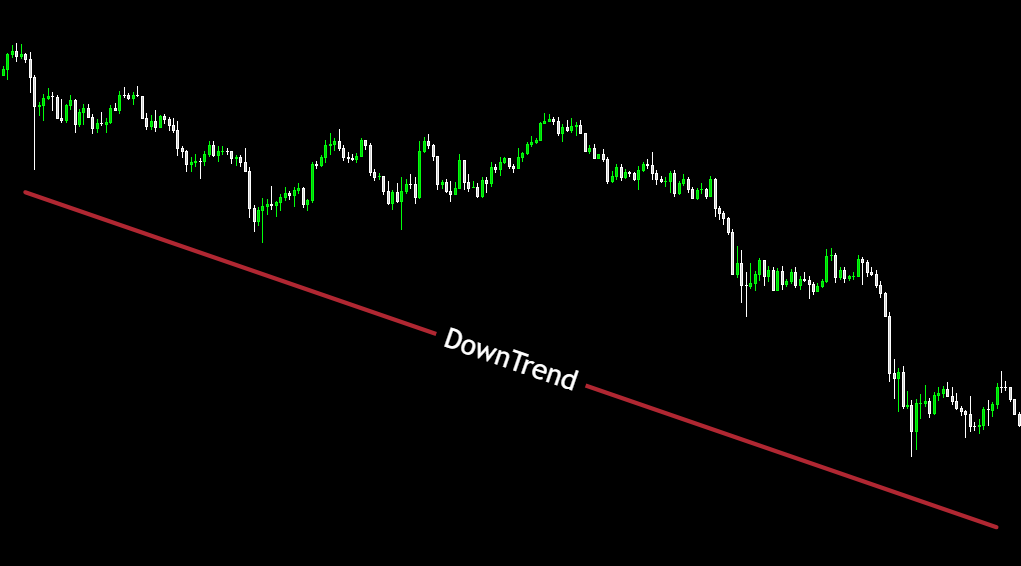
A downtrend usually means lower highs and lower lows.
A sideways market means price is ranging without a clear direction.
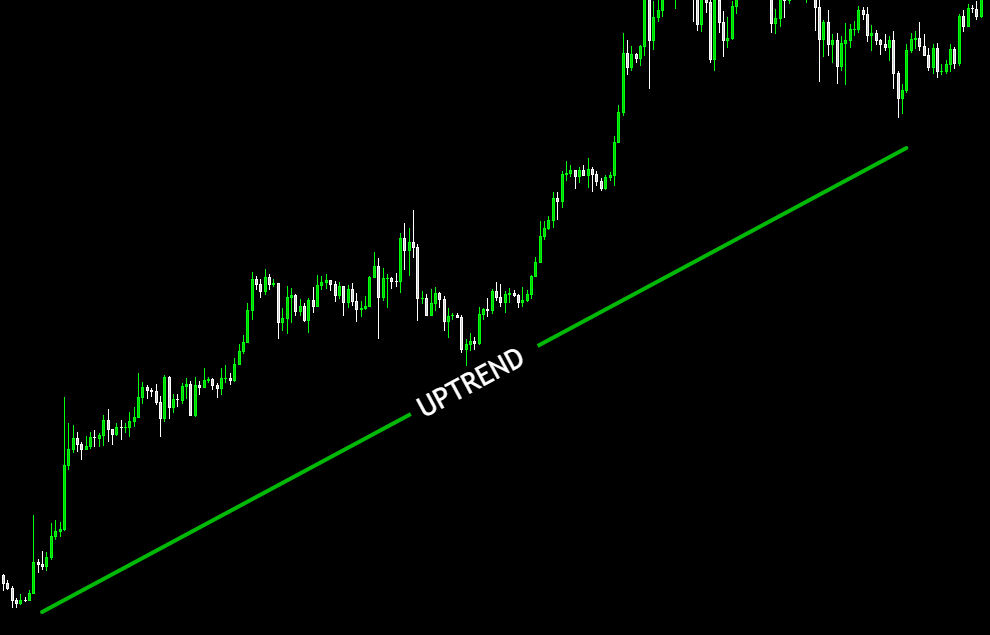
Start with price structure first: higher highs and higher lows usually signal an uptrend.
Use moving averages like MA50 and MA200 to help simplify the chart and confirm direction.
Check whether momentum indicators like RSI or MACD agree with the move.
Use higher timeframes for the bigger picture before focusing on lower timeframes.
A strong trend gives context to the rest of the chart.
It helps you judge whether pullbacks are normal or whether the move may be weakening.
Strong trends often lead to continuation setups, including breakouts and sustained momentum moves.
- Trying to call reversals too early before the chart structure has changed.
- Using indicators before understanding the underlying price trend.
- Ignoring the wider market context when judging a stock move.
Trend is one of the most important building blocks in chart reading.
It helps traders align with stronger moves instead of fighting them.
It helps identify stronger stocks showing momentum, leadership, and breakout potential.