Support & Resistance
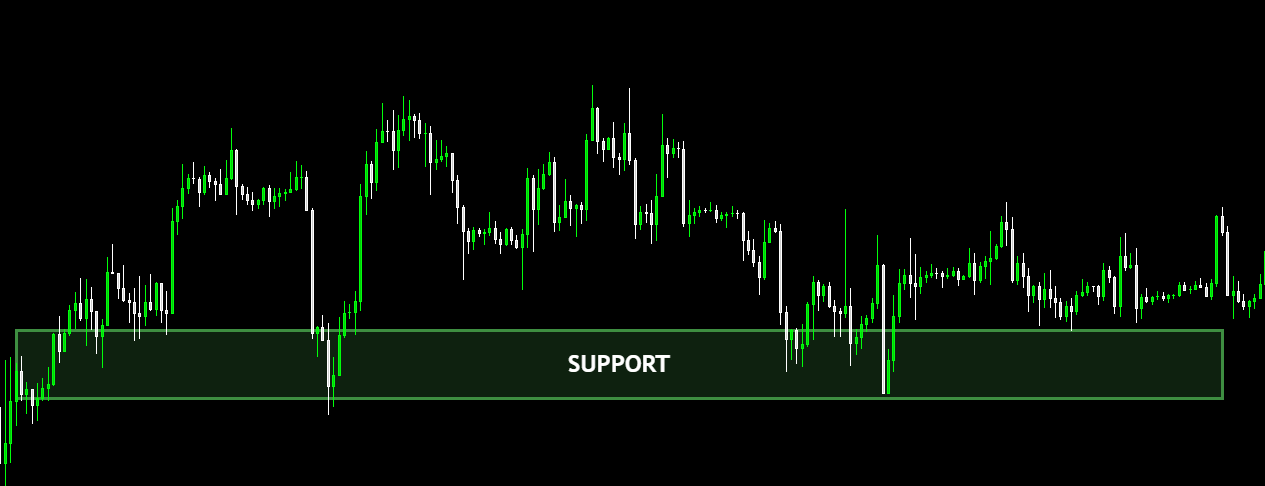
Support is a price area where buyers tend to step in and slow or stop a drop.
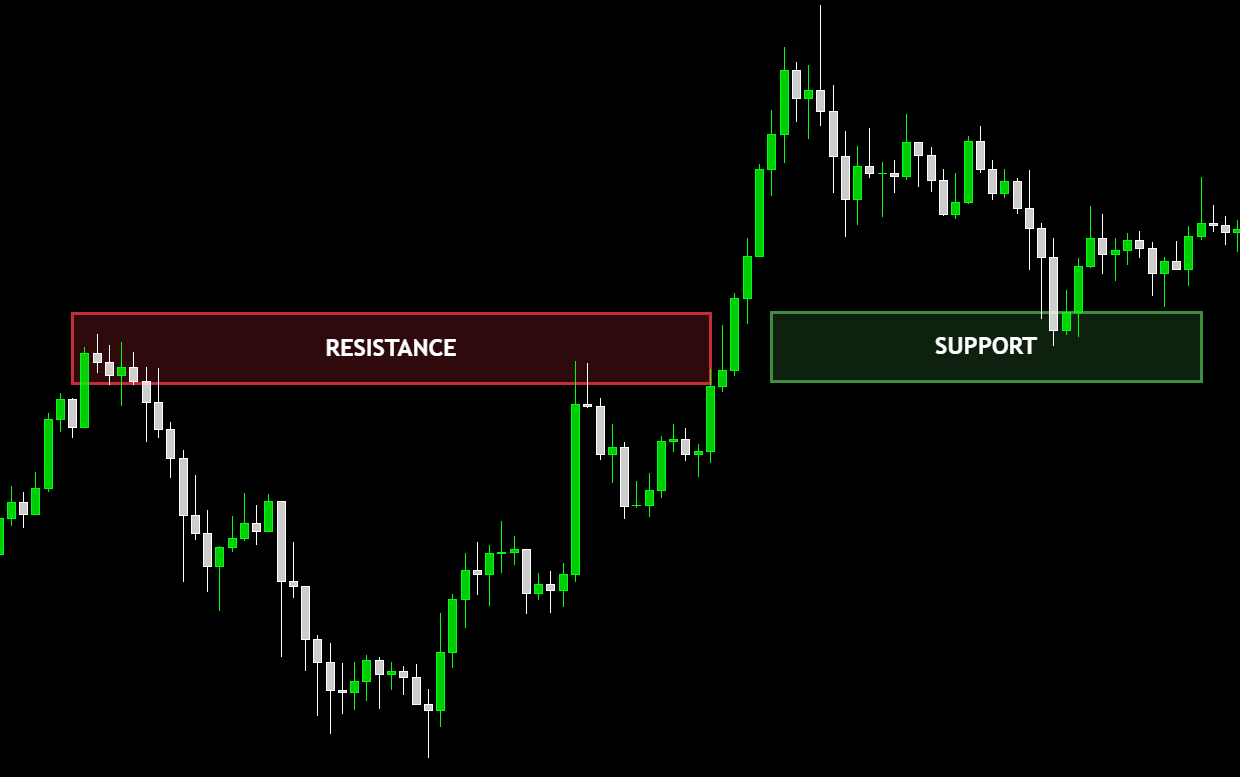
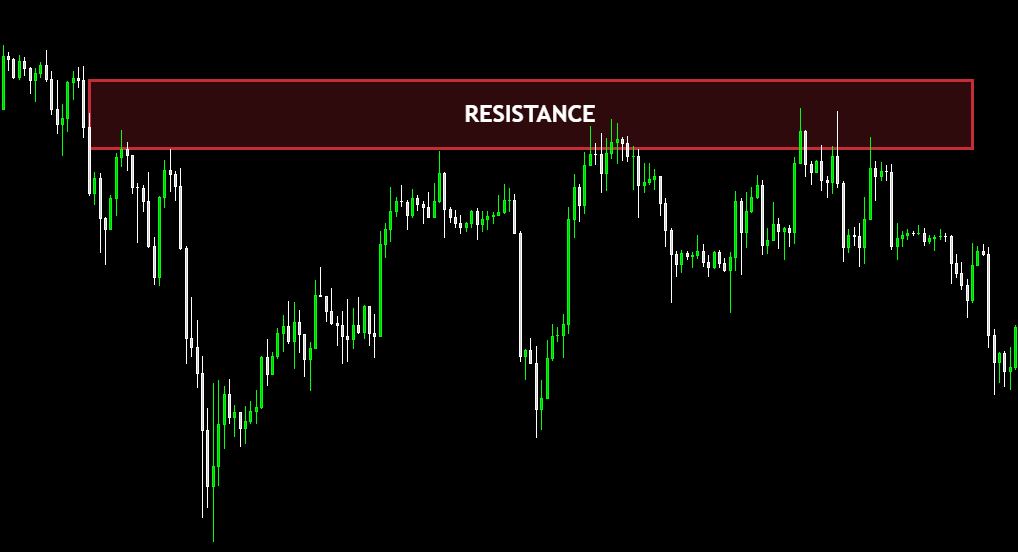
Resistance is a price area where sellers tend to step in and slow or stop a rise.
These levels form because many traders react to similar price areas.
Look for places where price has bounced or reversed more than once.
Support forms where price repeatedly stops falling.
Resistance forms where price repeatedly stops rising.
The more clean touches, the more meaningful the level can be.
At support, demand has shown up before and price may bounce or pause again.
At resistance, supply has shown up before and price may reject or stall again.
If a level breaks, price often moves faster as resistance or support is no longer holding.
- Treating levels as exact prices instead of zones (areas).
- Drawing too many lines until the chart becomes cluttered.
- Ignoring trend context (a level on a tiny timeframe can be meaningless).
Helps plan entries near areas where price often reacts.
Helps place stops logically (beyond the zone, not inside it).
Helps set targets based on nearby support and resistance levels.
Helps recognise breakouts, breakdowns, and key decision points.